पूर्वानुमान करना

Python में Bayesian डेटा विश्लेषण

Michal Oleszak

Machine Learning Engineer

क्लिक्स-की-संख्या मॉडल फिर से

formula = "num_clicks ~ clothes_banners_shown + sneakers_banners_shown + weekend"

with pm.Model() as model_2:
    pm.GLM.from_formula(formula, data=ads_aggregated)
    trace_2 = pm.sample(draws=1000, tune=500)
Python में Bayesian डेटा विश्लेषण

Ads टेस्ट डेटा

print(ads_test)
   clothes_banners_shown  sneakers_banners_shown  num_clicks  weekend
0                     40                      36           7     True
1                     42                      47           8    False
2                     45                      37          11    False
3                     22                      15           4    False
4                     20                      18           2    False
Python में Bayesian डेटा विश्लेषण

प्रेडिक्टिव ड्रॉज़ का सैंपलिंग

with pm.Model() as model:

pm.GLM.from_formula(formula, data=ads_test)
posterior_predictive = pm.fast_sample_posterior_predictive(trace_2)
Python में Bayesian डेटा विश्लेषण

प्रेडिक्टिव ड्रॉज़

posterior_predictive["y"].shape
(4000, 5)
print(posterior_predictive["y"])
array([[12.83527253, 10.22454815, 11.20386868,  7.50227286,  6.85458594],
       [ 3.1015655 ,  6.1253004 , 11.38324931,  2.1844722 ,  4.21451756],
       [ 3.40141276,  9.10157964,  6.57689421,  8.26669814,  4.23812161],
       ...,
       [10.97303606,  9.0772305 , 10.6877039 ,  1.78448969,  6.75663075],
       [ 8.53734584, 12.14079593, 11.00969881,  4.69875055,  8.317338  ],
       [16.44713387, 17.35163824, 19.59359831,  2.84058536,  4.21108186]])
Python में Bayesian डेटा विश्लेषण

पूर्वानुमान कितना अच्छा है?

   clothes_banners_shown  sneakers_banners_shown  num_clicks  weekend
0                     40                      36           7     True
pm.plot_posterior(posterior_predictive["y"][:, 0])
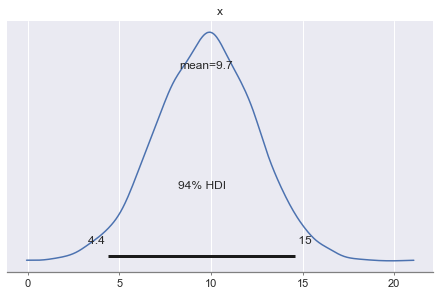
प्रेडिक्टिव ड्रॉज़ का डेंसिटी प्लॉट, जिसके ऊपर mean और credible interval चिह्नित हैं.

Python में Bayesian डेटा विश्लेषण

टेस्ट एरर डिस्ट्रिब्यूशन

errors = []


for index, test_example in ads_test.iterrows():
error = posterior_predictive["y"][:, index] - test_example["num_clicks"]
errors.append(error)
error_distribution = np.array(errors).reshape(-1)
error_distribution.shape
(20000,)
pm.plot_posterior(error_distribution)
Python में Bayesian डेटा विश्लेषण

टेस्ट एरर डिस्ट्रिब्यूशन

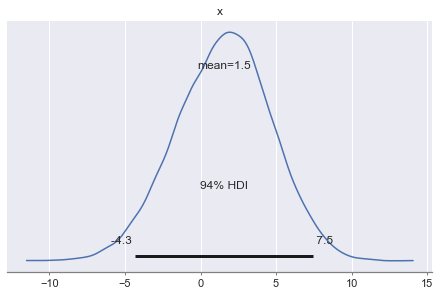
मॉडल एरर का डेंसिटी प्लॉट, जिसके ऊपर mean और credible interval चिह्नित हैं.

Python में Bayesian डेटा विश्लेषण

चलिए पूर्वानुमान करते हैं!

Python में Bayesian डेटा विश्लेषण

Preparing Video For Download...