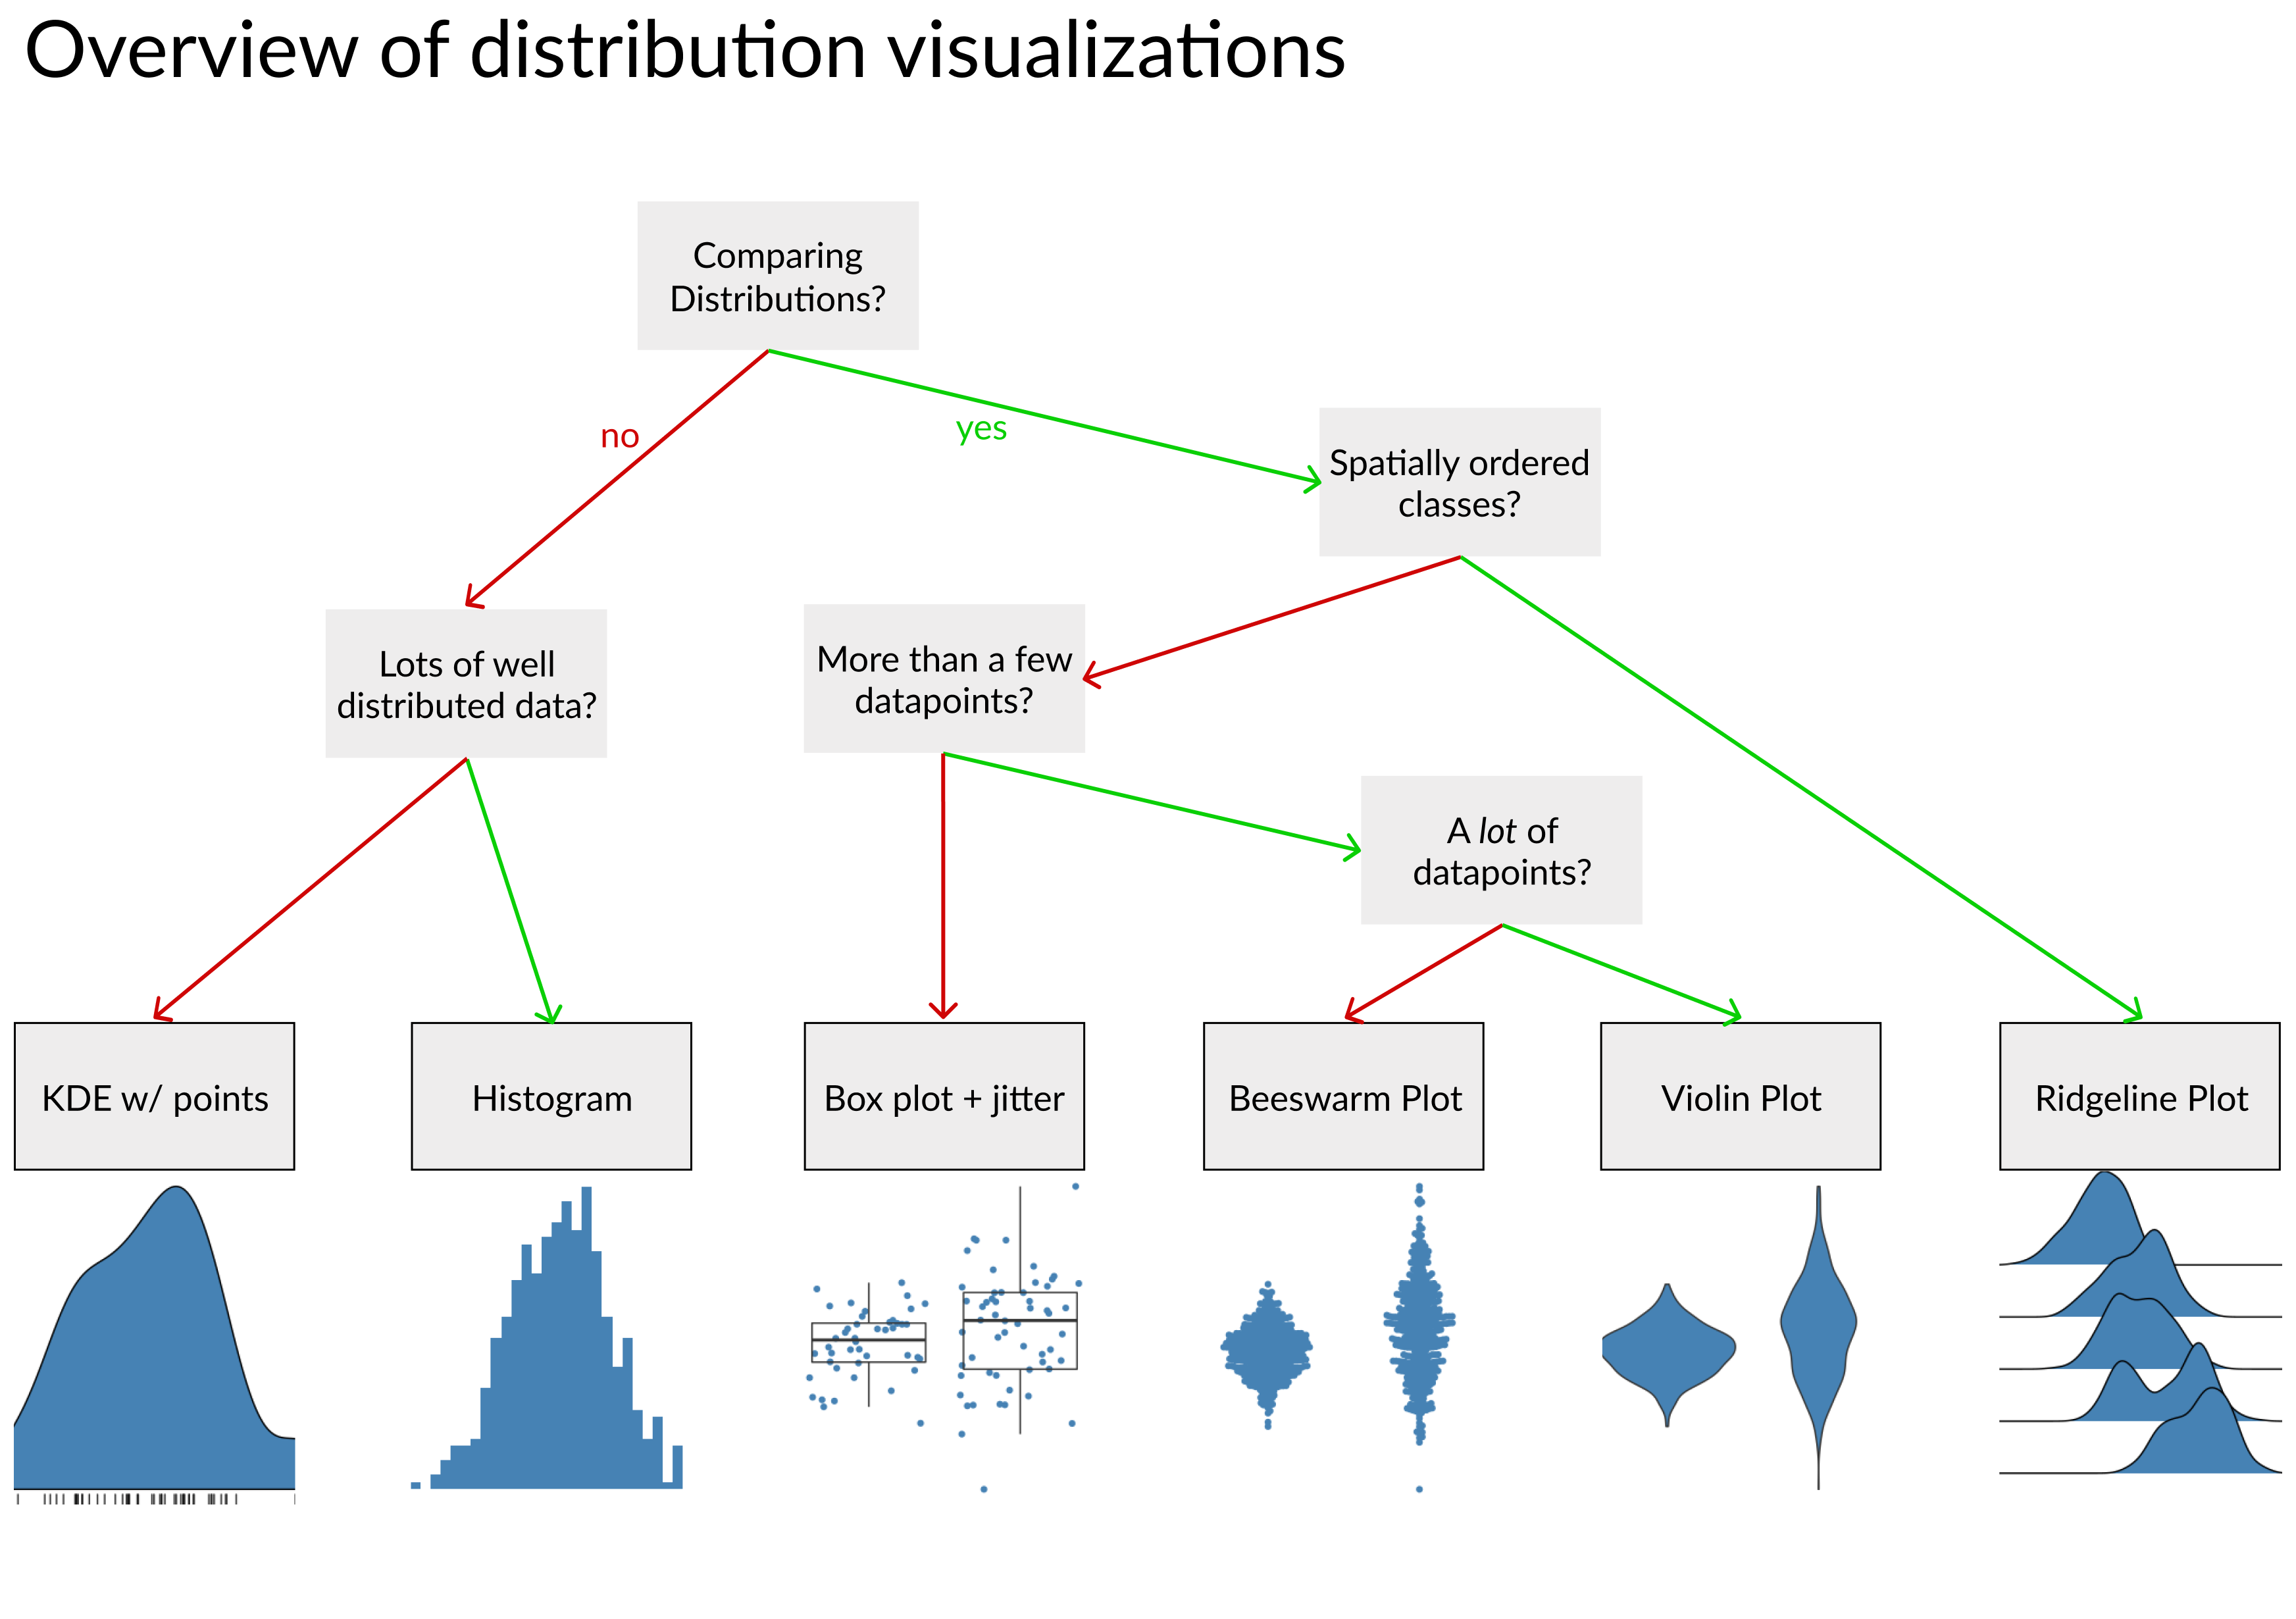
स्थानिक रूप से संबंधित वितरणों की तुलना
R में Visualization की Best Practices

Nick Strayer
Instructor
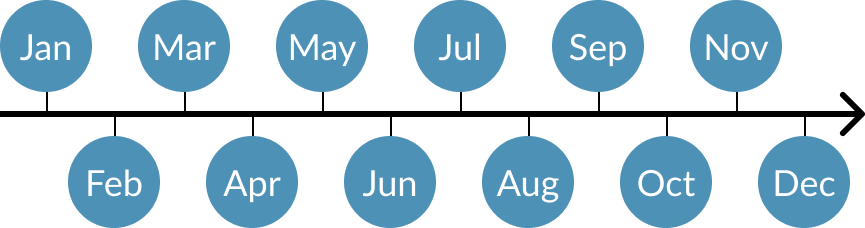
'spatially connected axes' क्या हैं?
- कक्षाओं में एक अंतर्निहित क्रम होता है.
- जैसे, साल के महीने: Jan < Feb < Mar < ...
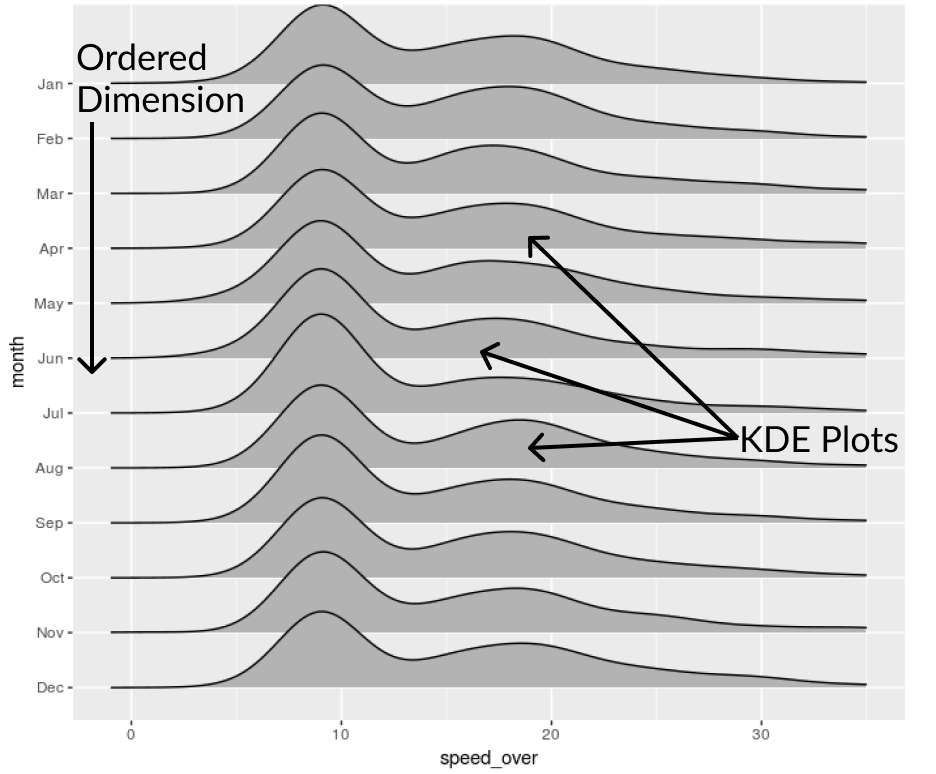
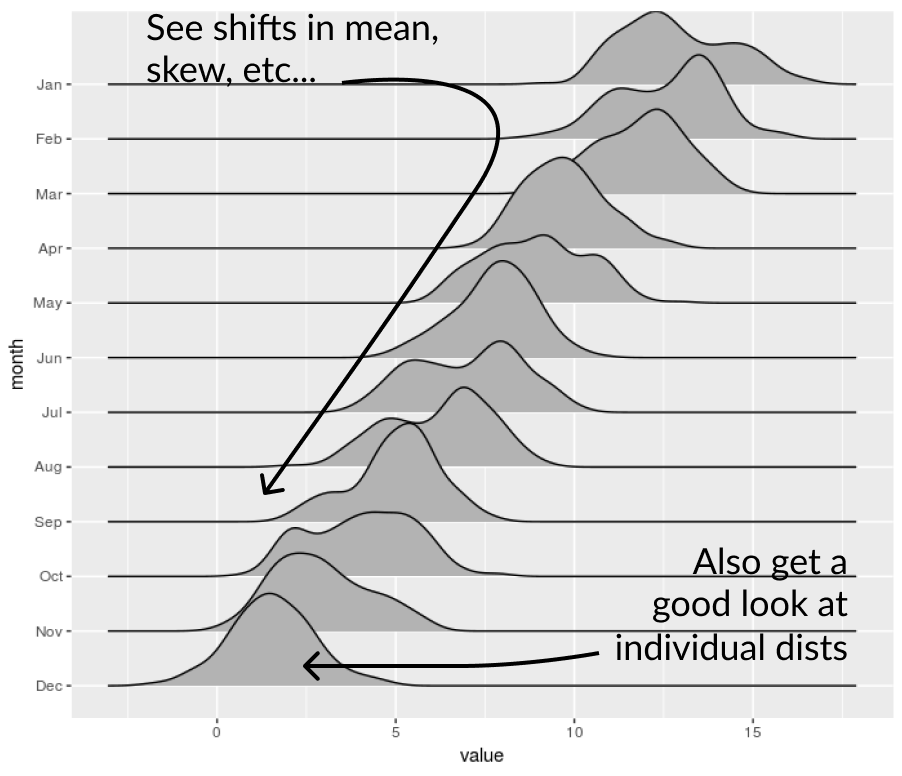
रिजलाइन प्लॉट
library(ggridges) # Gives us geom_density_ridges()
ggplot(md_speeding, aes(x = speed_over, y = month)) +
  geom_density_ridges(bandwidth = 2) +
  xlim(1, 35)
रिजलाइन के फायदे
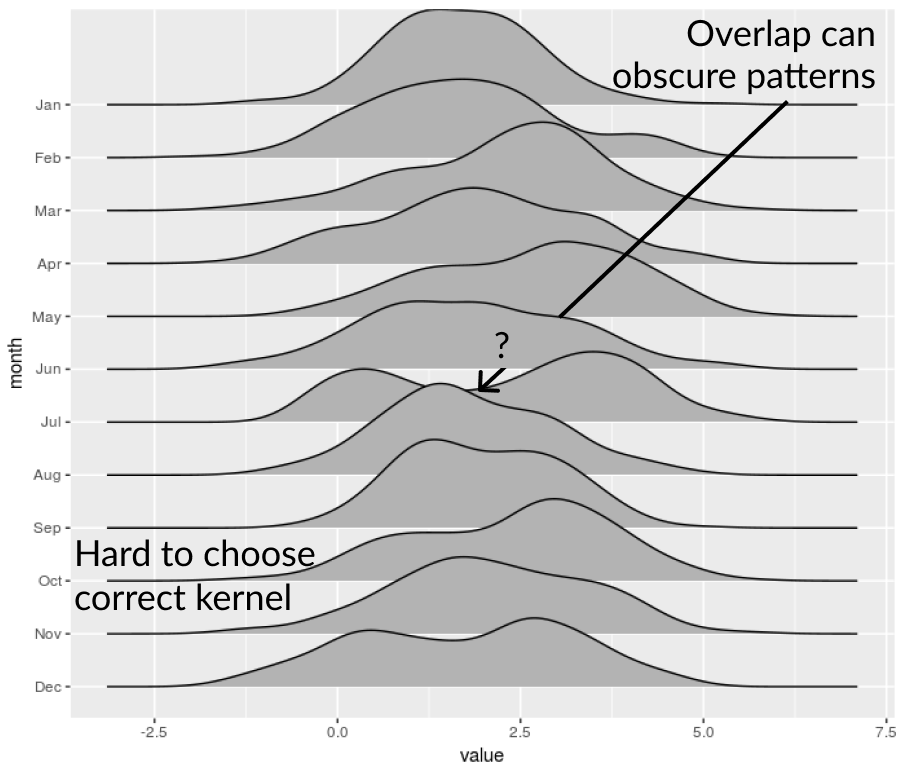
रिजलाइन की सीमाएँ