बार्स कब उपयोग करें

R में Visualization की Best Practices

Nick Strayer

Instructor

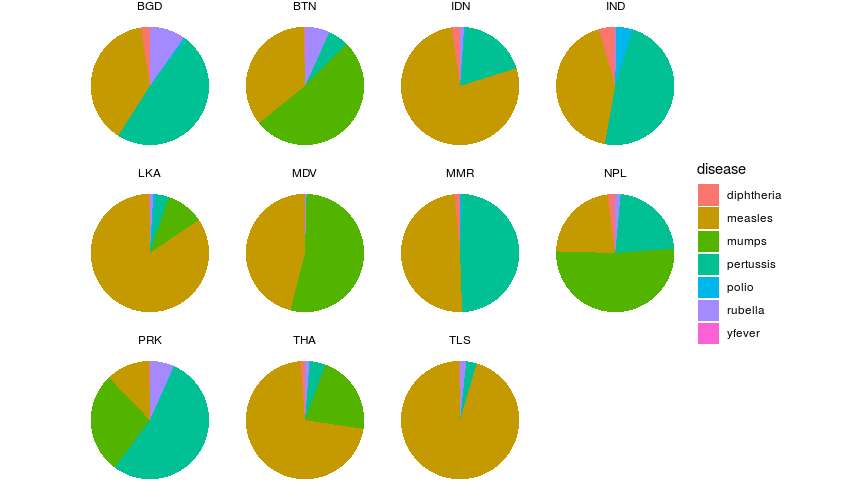
फैसटिंग क्यों नहीं?

  • तुलना करना लगभग असंभव

R में Visualization की Best Practices

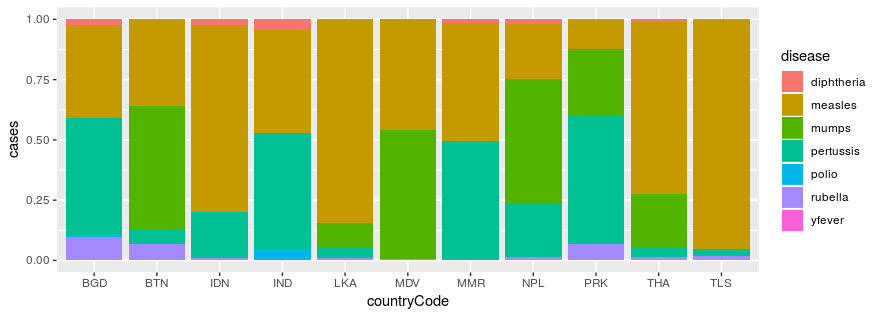
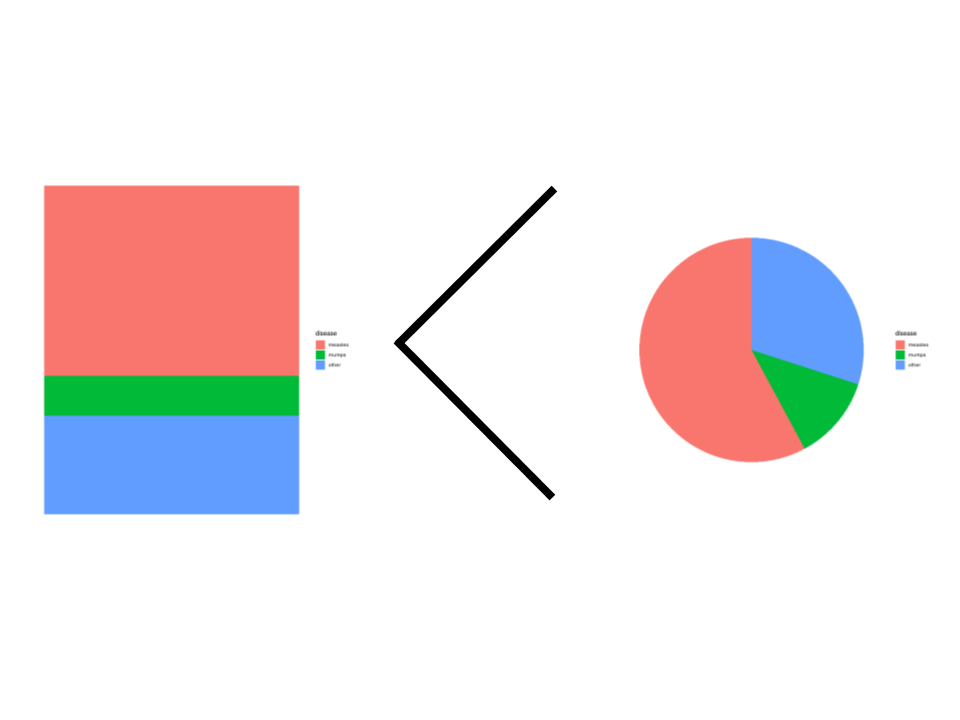
स्टैक्ड बार चार्ट

  • प्रत्येक आबादी को एक ही y-axis साझा करने दें
  • वर्टिकल पोजीशन/आकार के आधार पर तुलना आसान होती है
who_disease %>% 
  filter(region == 'SEAR') %>% 
  ggplot(aes(x = countryCode, y = cases, fill = disease)) +
    geom_col(position = 'fill')

R में Visualization की Best Practices

सावधानियाँ

  • अकेले में पाई या वाफल चार्ट से भी खराब
  • 3 क्लास के बाद सटीकता तेज़ी से घटती है
R में Visualization की Best Practices

अध्याय रिकैप

Proportions:

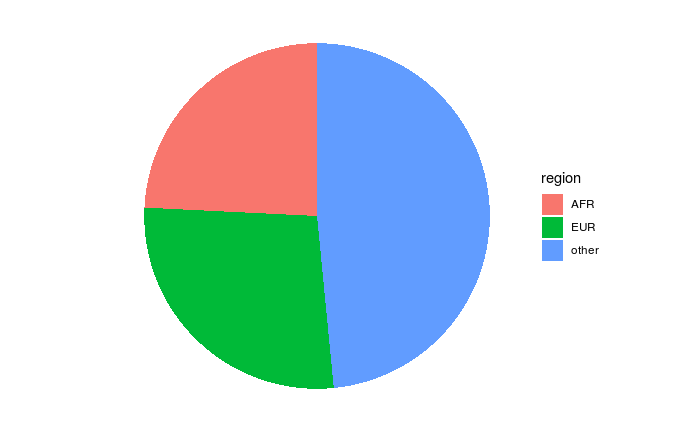
Pie charts:
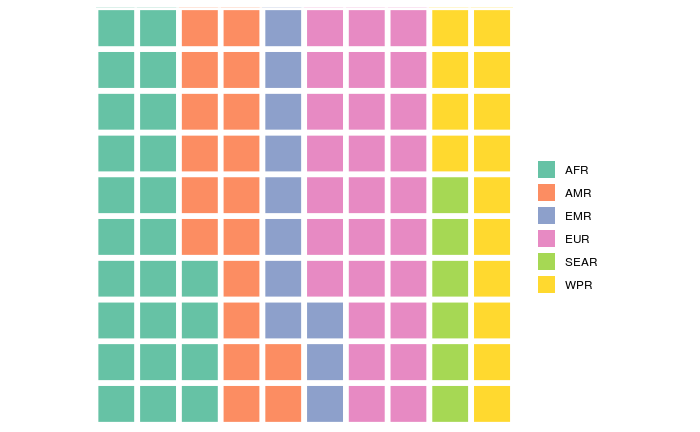
Waffle charts:
Stacked bars:

R में Visualization की Best Practices

अभ्यास करते हैं!

R में Visualization की Best Practices

Preparing Video For Download...