geopandas के साथ कोरोप्लेत

Python में Geospatial Data का Visualization

Mary van Valkenburg

Data Science Program Manager, Nashville Software School
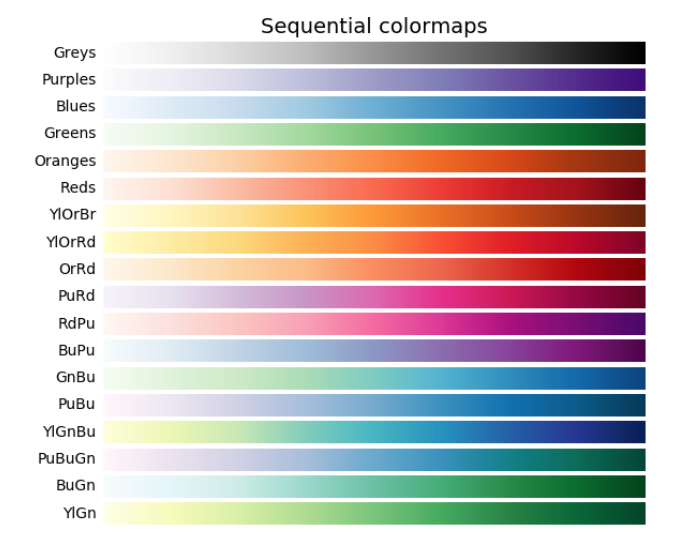
क्रमिक कोलormap का चार्ट

Python में Geospatial Data का Visualization

GeoDataFrame.plot() से कोरोप्लेत

districts_with_counts.plot(column = 'school_density', legend = True)
plt.title('Schools per decimal degrees squared area')
plt.xlabel('longitude')
plt.ylabel('latitude');
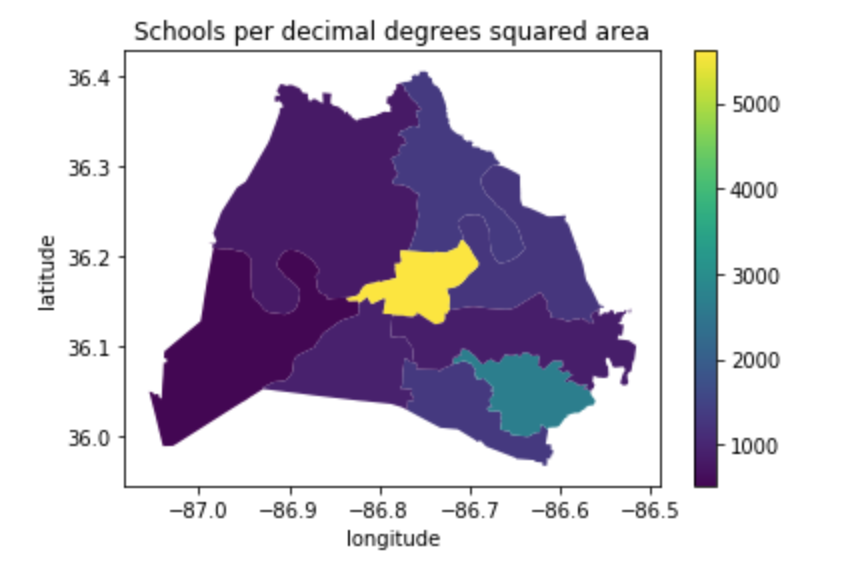
viridis colormap के साथ स्कूल घनत्व का कोरोप्लेत

Python में Geospatial Data का Visualization

GeoDataFrame.plot() से कोरोप्लेत

districts_with_counts.plot(column = 'school_density', cmap = 'BuGn', edgecolor = 'black', legend = True)
plt.title('Schools per decimal degrees squared area')
plt.xlabel('longitude')
plt.ylabel('latitude');
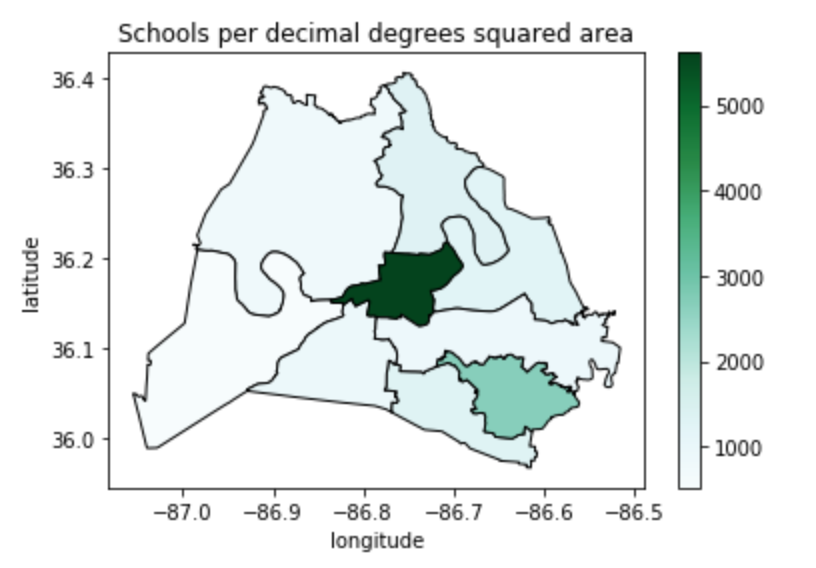
नीले-हरे colormap के साथ स्कूल घनत्व का कोरोप्लेत

Python में Geospatial Data का Visualization

क्षेत्रफल (किमी²) में

# starting CRS
print(school_districts.crs)
epsg:4326
# convert to EPSG 3857
school_districts = school_districts.to_crs(epsg = 3857)
print(school_districts.crs)
epsg:3857
Python में Geospatial Data का Visualization

क्षेत्रफल (किमी²) में

# define a variable for m^2 to km^2
sqm_to_sqkm = 10**6

school_districts['area'] = school_districts.area / sqm_to_sqkm
school_districts.head(2)
district    geometry                             area
1          (POLYGON ((-965.055 4353528.766...    563.134380
3          (POLYGON ((-965.823 4356392.677...    218.369949
Python में Geospatial Data का Visualization
# change crs back to 4326
school_districts = school_districts.to_crs(epsg = 4326)
print(school_districts.crs)
epsg:4326
print(school_districts.head(2))
district      geometry                       area
1             (POLYGON ((-86.771 36.383...   563.134380
3             (POLYGON ((-86.753 36.404...   218.369949
# spatial join to get districts that contain schools
schools_in_districts = gpd.sjoin(school_districts, schools_geo, predicate = 'contains')
Python में Geospatial Data का Visualization
# aggregate to get counts
school_counts = schools_in_districts.groupby(['district']).size()
# convert school_counts to a df 
school_counts_df = school_counts.to_frame()
school_counts_df = school_counts_df.reset_index(level=0)
school_counts_df.columns = ['district', 'school_count']
# merge
districts_with_counts = pd.merge(school_districts,
                                 school_counts_df, on = 'district')
districts_with_counts.head(1)
district  geometry                       area       school_count
1         (POLYGON ((-86.771 36.383..    563.134380    30
Python में Geospatial Data का Visualization

स्कूल घनत्व निकालना

# create school_density
districts_with_counts['school_density'] = districts_with_counts.apply(
    lambda row: row.school_count/row.area, axis = 1)
# plot it
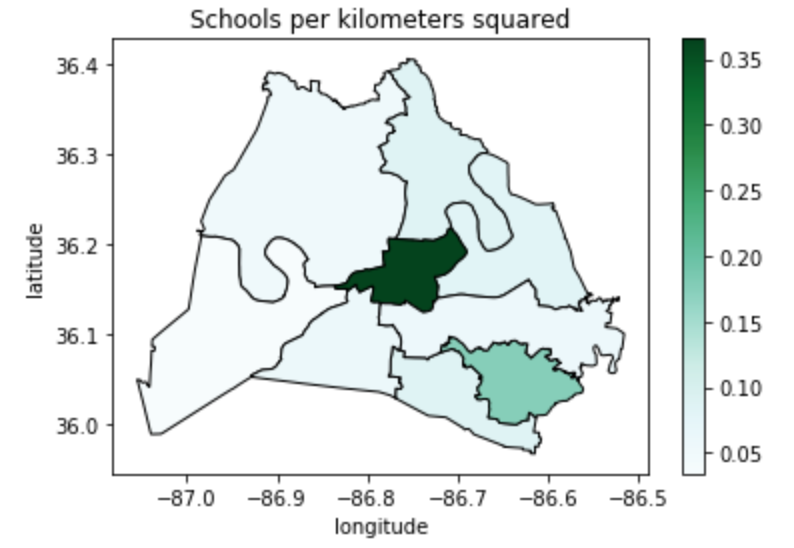
districts_with_counts.plot(column = 'school_density', cmap = 'BuGn', 
                           edgecolor = 'black', legend = True)
plt.title('Schools per kilometers squared')
plt.xlabel('longitude')
plt.ylabel('latitude')
plt.show();
Python में Geospatial Data का Visualization

प्रति वर्ग किलोमीटर स्कूल घनत्व का कोरोप्लेत

Python में Geospatial Data का Visualization

अभ्यास करते हैं!

Python में Geospatial Data का Visualization

Preparing Video For Download...