जियोमेट्री और शेपफाइल्स

Python में Geospatial Data का Visualization

Mary van Valkenburg

Data Science Program Manager, Nashville Software School

Shapefiles

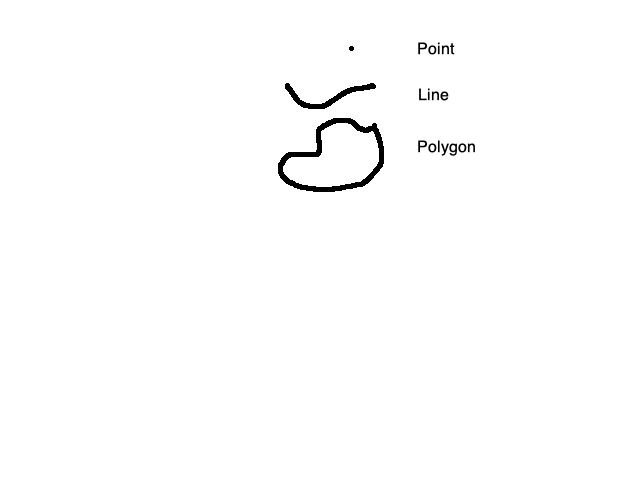
Shapefiles एक खास तरह का डेटा सेव करते हैं जिसे geometry कहा जाता है.

बिंदु, रेखा, बहुभुज

Python में Geospatial Data का Visualization

Shapefile के हिस्से

सभी फाइलें साथ रखें!
$ ls my_map_files/

my_map.dbf
my_map.shp
my_map.shx
  • my_map.shp (geometry रखती है)
  • my_map.dbf (हर geometry के attributes रखती है)
  • my_map.shx (attributes को geometry से जोड़ती है)
Python में Geospatial Data का Visualization

geopandas

यह कोड एक shapefile को GeoDataFrame में पढ़ता है और शुरुआती कुछ rows दिखाता है.

import geopandas as gpd

geo_df = gpd.read_file('My_Map_Files/my_map.shp')
geo_df.head()
Python में Geospatial Data का Visualization

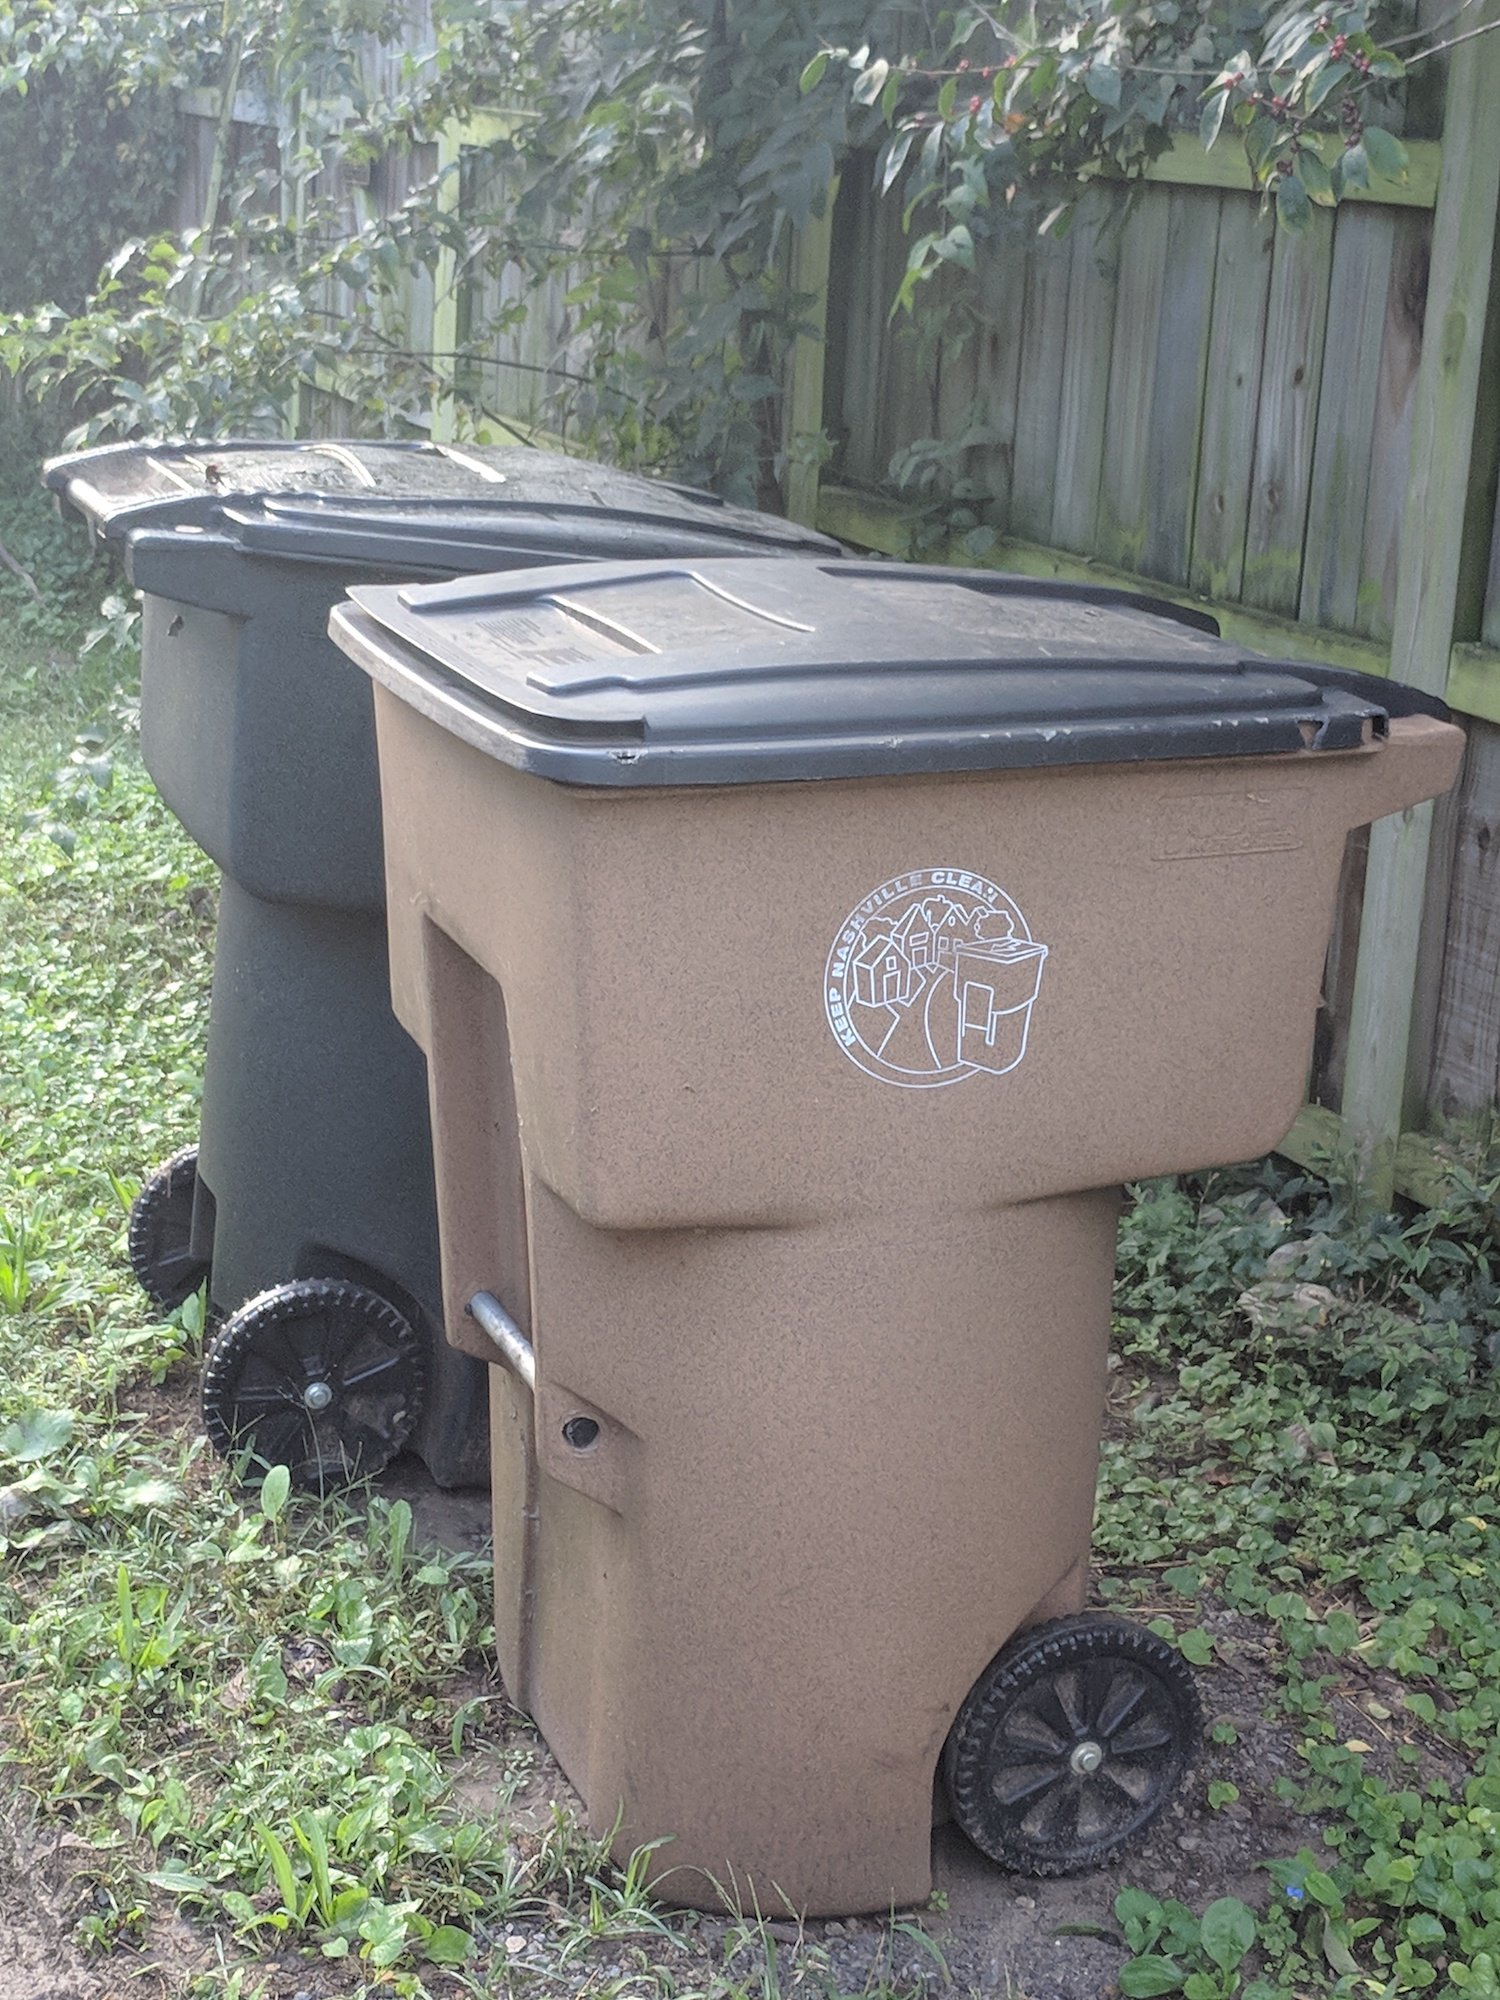
कचरा और रीसायकल डिब्बे

Python में Geospatial Data का Visualization

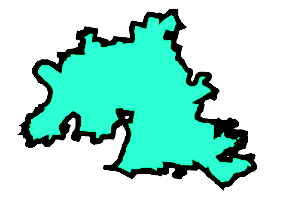
Geometry देखना

service_district.loc[0, 'geometry']

सेवा जिले का बहुभुजी निरूपण

Python में Geospatial Data का Visualization

Geometry प्रिंट करना

print(service_district.loc[0, 'geometry'])
POLYGON ((-86.68680500011935 36.28670500013504, 
-86.68706099969657 36.28550299967364, -86.68709498823965 36.28511683351293,
-86.68712691935902 36.28475404474551, -86.6871549990252 36.28443499969863,
-86.68715025108719 36.28438104319917, -86.68708600011215 36.2836510002216,
-86.6870599998375 36.28335400009232, -86.68683200030846 36.28073200026927,
-86.68678671280243 36.2804916722591, -86.68668199966068 36.27993600019391,
-86.686543000303 36.27920000021985, -86.68641799989246 36.27853199938513,
-86.68600744248923 36.27759483150202, -86.68579942352289 36.27711998225582,
-86.68482299948184 36.2748910007355, -86.68476799897849 36.27478700083996,
-86.68372700043393 36.27281799971492, -86.6832880000829 36.27208000018629,
-86.68313199902317 36.27181700012145, -86.68278700024624 36.27108100075766,
-86.68257822861736 36.27077209799597, -86.68177585777893 36.2694062861527....

Python में Geospatial Data का Visualization

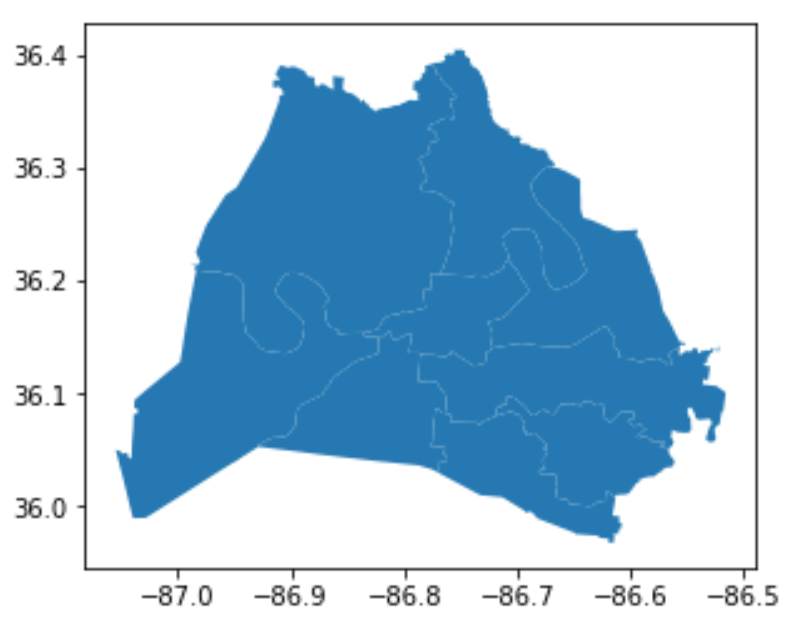
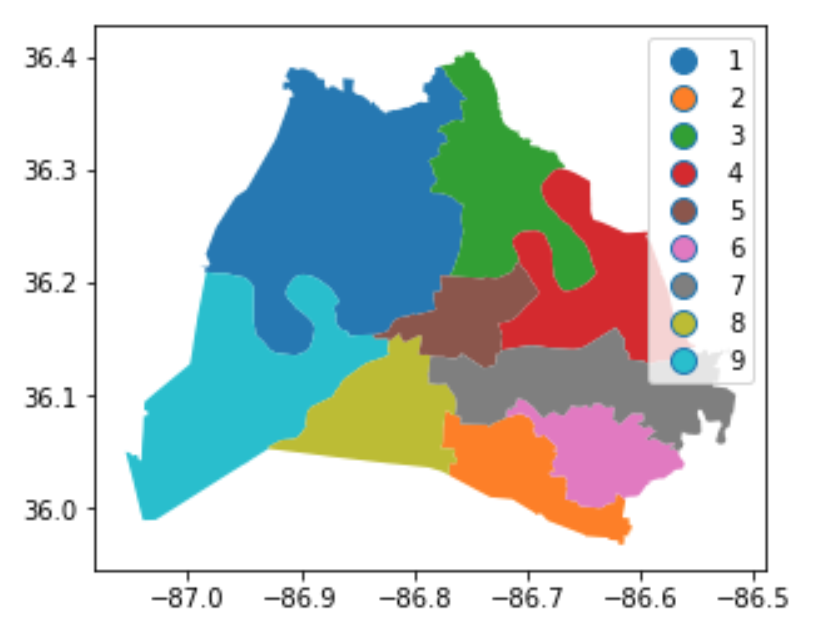
GeoDataFrame प्लॉट करना

school_districts.plot()
plt.show()
school_districts.plot(column = 
                     'district', 
                     legend = True)
plt.show()

स्कूल जिलों का ठोस नीला प्लॉट

अलग-अलग रंगों वाले क्षेत्रों सहित स्कूल जिलों का प्लॉट

Python में Geospatial Data का Visualization

अभ्यास करते हैं!

Python में Geospatial Data का Visualization

Preparing Video For Download...