Choropleth क्या है?

Python में Geospatial Data का Visualization

Mary van Valkenburg

Data Science Program Manager, Nashville Software School

Choropleth की परिभाषा
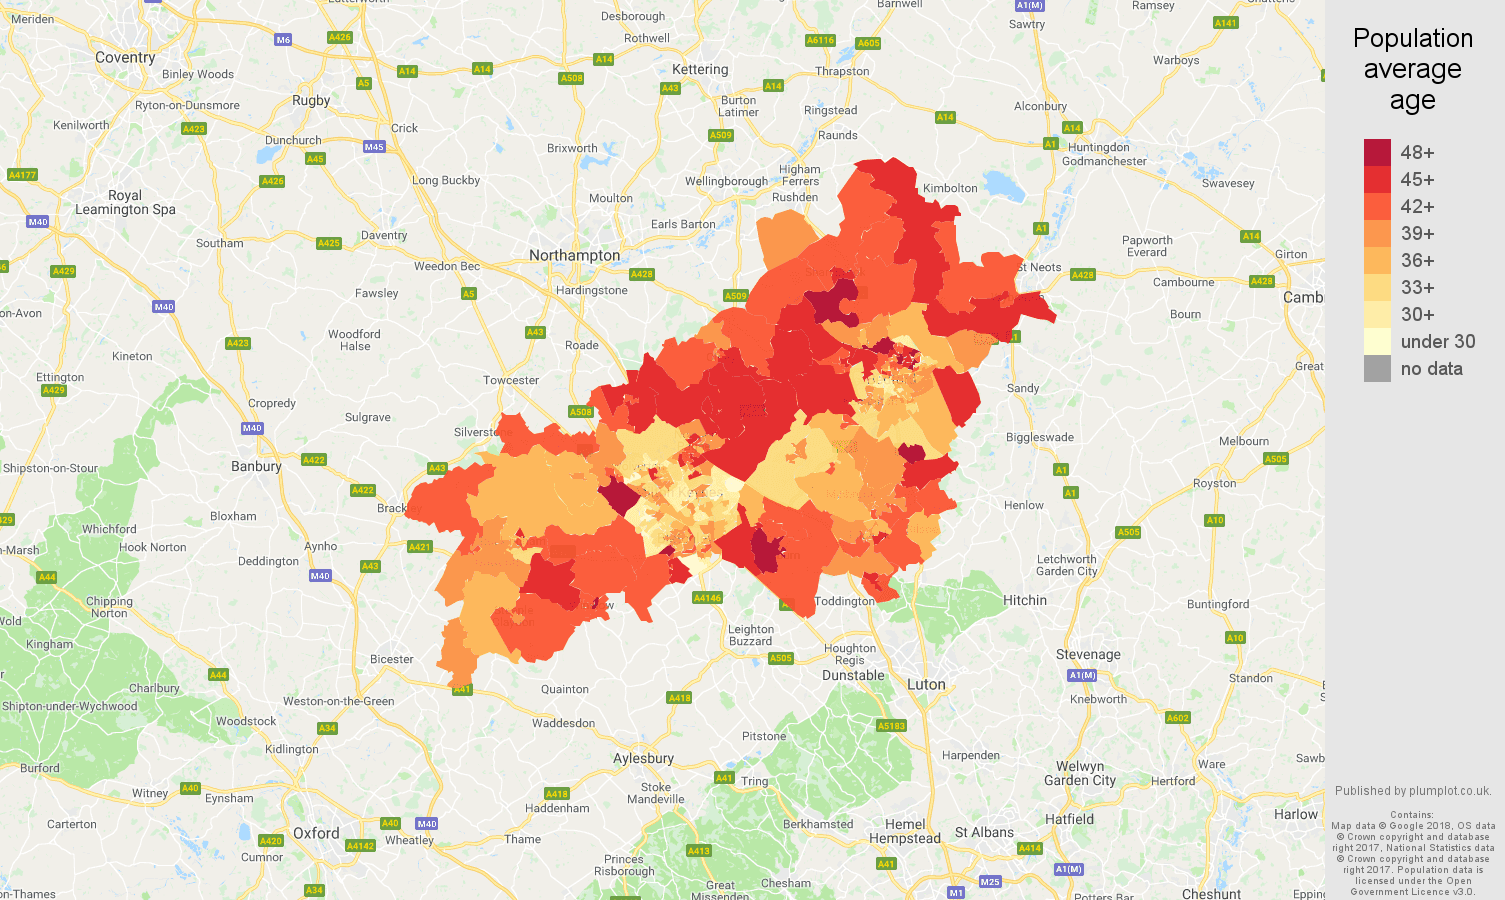
मिल्टन कीन्स के LSOAs में औसत निवासी उम्र का choropleth

Python में Geospatial Data का Visualization

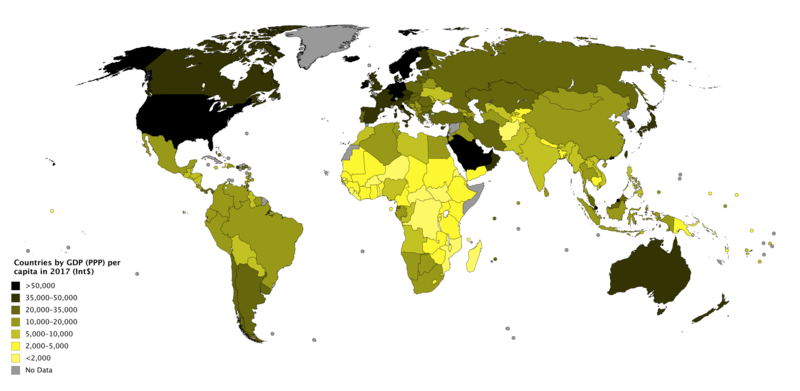
विश्व GDP per capita PPP का choropleth

Python में Geospatial Data का Visualization

Density

schools_in_districts.head(2)
district  geometry                  name               lat    lng
1         (POLYGON ((-86.77 36.38... Nashville Prep    36.16 -86.85
1         (POLYGON ((-86.77 36.38... Rocketship Prep   36.17 -86.79
Python में Geospatial Data का Visualization

गिनती पाएँ

school_counts = schools_in_districts.groupby(['district']).size()
print(school_counts)
district
1    30
2    11
3    19
4    18
5    36
6    21
7    13
8    10
9    12
dtype: int64
Python में Geospatial Data का Visualization

गिनती जोड़ें

school_counts_df = school_counts.to_frame()
school_counts_df = school_counts_df.reset_index()
school_counts_df.columns = ['district', 'school_count']
districts_with_counts = pd.merge(school_districts, school_counts_df, 
                                 on = 'district')
districts_with_counts.head(2)
district geometry           school_count
1        (POLYGON ((-86.77 36.38...  30
3        (POLYGON ((-86.75 36.40...  19
Python में Geospatial Data का Visualization

गिनती को क्षेत्रफल से भाग दें

districts_with_counts['area'] = districts_with_counts.area
districts_with_counts['school_density'] = districts_with_counts.apply(
    lambda row: row.school_count/row.area, axis = 1)

districts_with_counts.head(2)
district geometry           school_count   area    school_density
1        (POLYGON ((-86.77 36.38...    30    0.036641    818.745403
3        (POLYGON ((-86.75 36.40...    19    0.014205    1337.594495
Python में Geospatial Data का Visualization

अभ्यास करते हैं!

Python में Geospatial Data का Visualization

Preparing Video For Download...