Spatial joins

Python में Geospatial Data का Visualization

Mary van Valkenburg

Data Science Program Manager, Nashville Software School

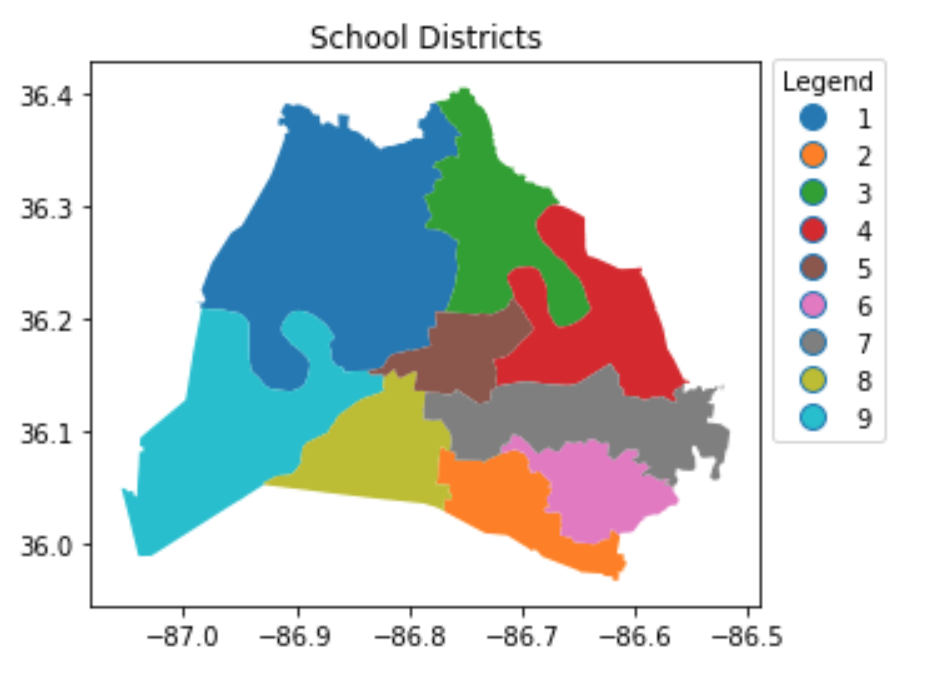
काउंसिल जिले और स्कूल जिले
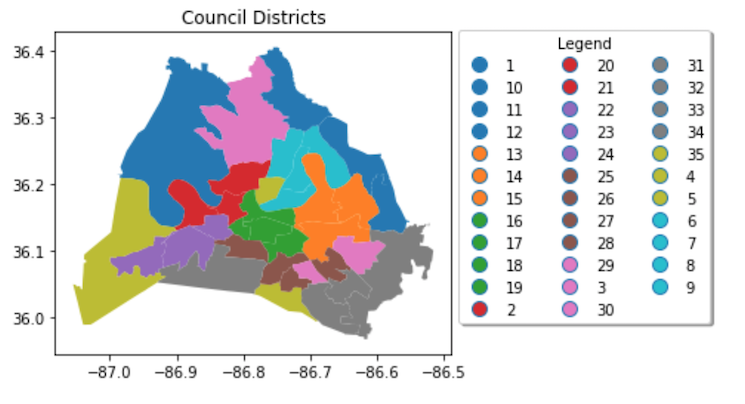
35 काउंसिल जिलों का प्लॉट

9 स्कूल जिलों का प्लॉट

Python में Geospatial Data का Visualization

.sjoin() का predicate आर्ग्युमेंट

import geopandas as gpd

gpd.sjoin(blue_region_gdf, black_point_gdf, predicate = <how to build>)

predicate intersects, contains, और within हो सकता है

Python में Geospatial Data का Visualization

.sjoin() का उपयोग

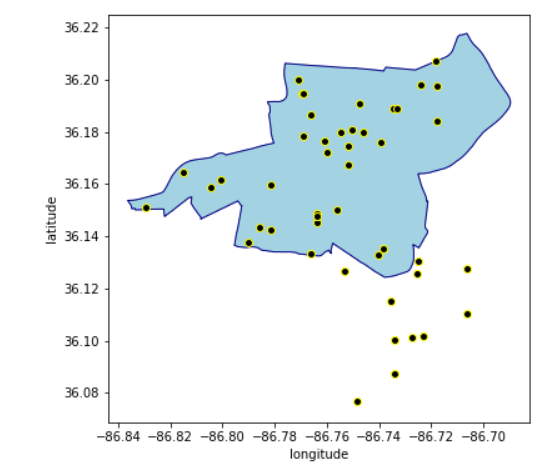
नीले रीजन के साथ काले पॉइंट्स का प्लॉट

Python में Geospatial Data का Visualization

predicate = 'intersects'

gpd.sjoin(blue_region_gdf, black_point_gdf, predicate = 'intersects')
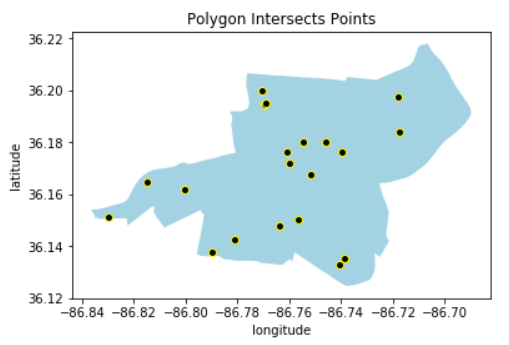
हल्के नीले बहुभुज में काले पॉइंट्स

Python में Geospatial Data का Visualization

predicate = 'contains'

gpd.sjoin(blue_region_gdf, black_point_gdf, predicate = 'contains')
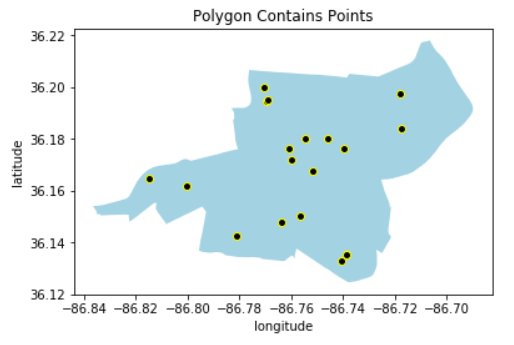
हल्के नीले बहुभुज में काले पॉइंट्स

Python में Geospatial Data का Visualization

predicate = 'within'

gpd.sjoin(black_point_gdf, blue_region_gdf, predicate = 'within')
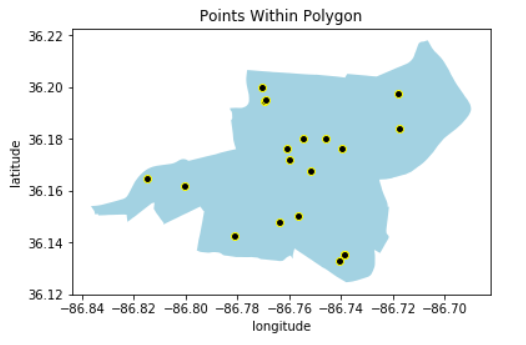
हल्के नीले बहुभुज में काले पॉइंट्स

Python में Geospatial Data का Visualization

.sjoin() का predicate आर्ग्युमेंट - within

# find council districts within school districts

within_gdf = gpd.sjoin(council_districts, school_districts, predicate = 'within')

print('council districts within school districts: ', within_gdf.shape[0])
council districts within school districts:  11
Python में Geospatial Data का Visualization

.sjoin() का predicate आर्ग्युमेंट - contains

# find school districts that contain council districts

contains_gdf = pd.sjoin(school_districts, council_districts, predicate = 'contains')

print('school districts contain council districts: ', contains_gdf.shape[0])
school districts contain council districts:  11
Python में Geospatial Data का Visualization

.sjoin() का predicate आर्ग्युमेंट - intersects

# find council districts that intersect with school districts

intersect_gdf = gpd.sjoin(council_districts, school_districts, predicate = 'intersects')

print('council districts intersect school districts: ', intersect.shape[0])
council districts intersect school districts:  100
Python में Geospatial Data का Visualization

Spatial join के बाद GeoDataFrame की कॉलम्स

within_gdf = gpd.sjoin(council_districts, school_districts, predicate = 'within')
within_gdf.head()
  first_name_left  last_name_left district_left  index_right    
0 Nick             Leonardo            1              0              
1 DeCosta          Hastings            2              0 
2 Nancy            VanReece            8              1    
3 Bill             Pridemore           9              1    
9 Doug             Pardue             10              1    
Python में Geospatial Data का Visualization
# स्कूल जिले के अनुसार काउंसिल जिलों को एग्रीगेट करें - district_left और district_right का नाम बदलें
within_gdf.district_left = council_district
within_gdf.district_right = school_district
within_gdf[['council_district', 'school_district']
          ].groupby('school_district'
                   ).agg('count'
                        ).sort_values('council_district', ascending = False)
                   council_district 
school_district    
       3                   3
       1                   2
       9                   2
       2                   1
       5                   1
       6                   1
       8                   1
Python में Geospatial Data का Visualization

अभ्यास करते हैं!

Python में Geospatial Data का Visualization

Preparing Video For Download...