Testing differences between groups
HR Analytics: Exploring Employee Data in R

Ben Teusch
HR Analytics Consultant
Comparing two groups

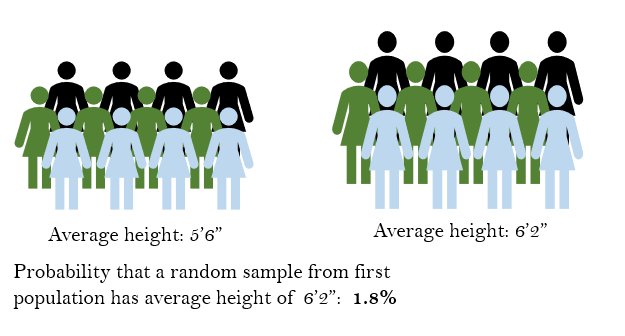
Quantifying the likelihood

The t-test
- Use when the variable to compare is continuous
t.test(tenure ~ is_manager, data = survey)
    Welch Two Sample t-test

data:  tenure by is_manager
t = -1.2158, df = 834.19, p-value = 0.2244
alternative hypothesis: true difference in means is not equal to 0
95 percent confidence interval:
 -0.34197615  0.08037243
sample estimates:
mean in group Non-manager mean in group Manager
                 7.376555            7.507357
The chi-squared test
- Use when the variable to compare is categorical
chisq.test(survey$left_company, survey$is_manager)
    Pearson's Chi-squared test with Yates' continuity correction

data:  survey$left_company and survey$is_manager
X-squared = 26.275, df = 1, p-value = 1.97e-06
Where are the formulas?
Let's practice!
HR Analytics: Exploring Employee Data in R

