team avg_calls
<fctr> <dbl>
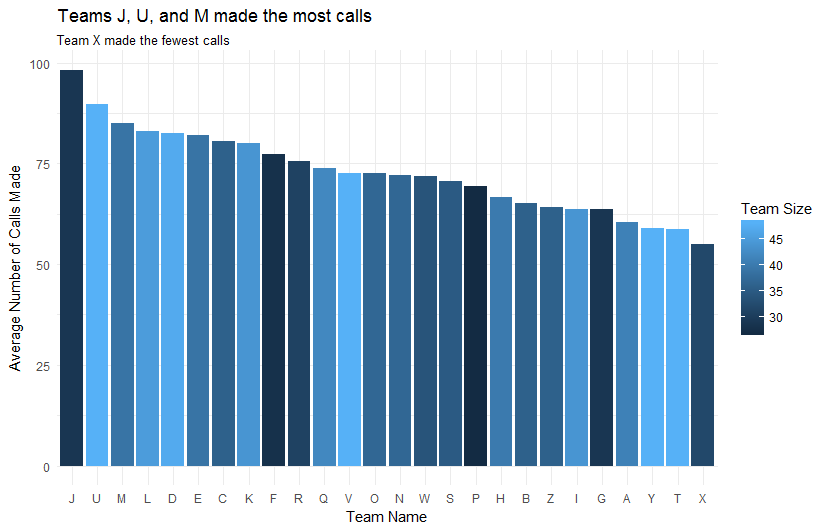
1 J 98.16318
2 U 89.64824
3 M 84.90123
4 L 82.90802
5 D 82.62958
6 E 82.08344
7 C 80.46505
8 K 79.91899
# ... with 18 more rows
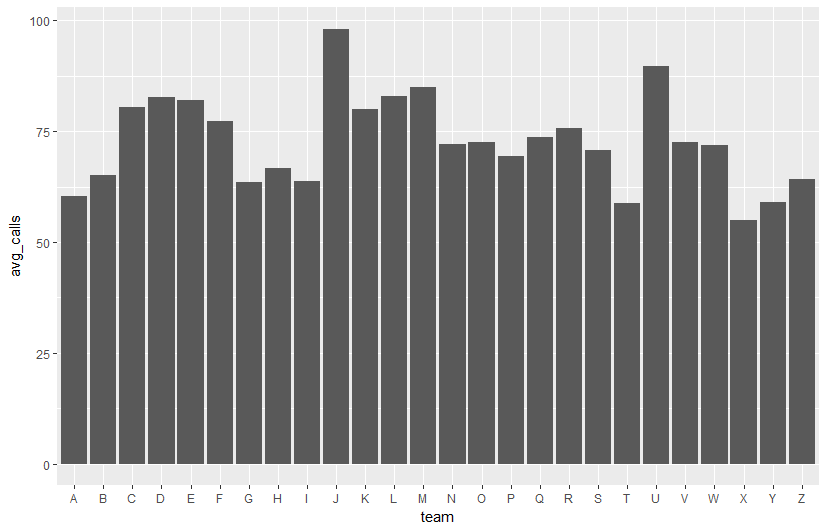
A simple bar chart
call_center_b_summary
     team avg_calls
   <fctr>     <dbl>
1       J  98.16318
2       U  89.64824
3       M  84.90123
4       L  82.90802
5       D  82.62958
6       E  82.08344
7       C  80.46505
8       K  79.91899
# ... with 18 more rows
ggplot(call_center_b_summary, aes(x = team, y = avg_calls)) +
  geom_col()