Visualizing engagement data
HR Analytics: Exploring Employee Data in R

Ben Teusch
HR Analytics Consultant
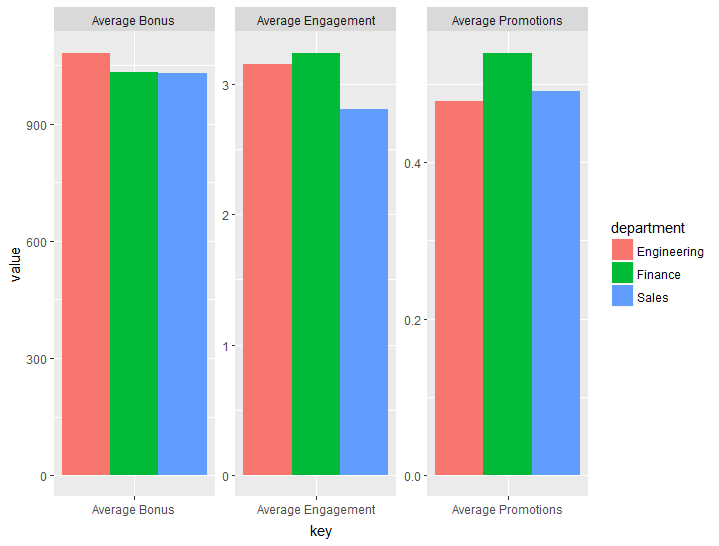
Visualizing several variables at once
The tidyr package
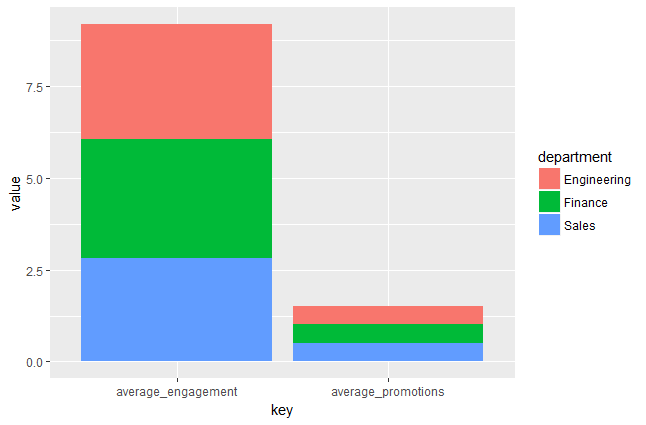
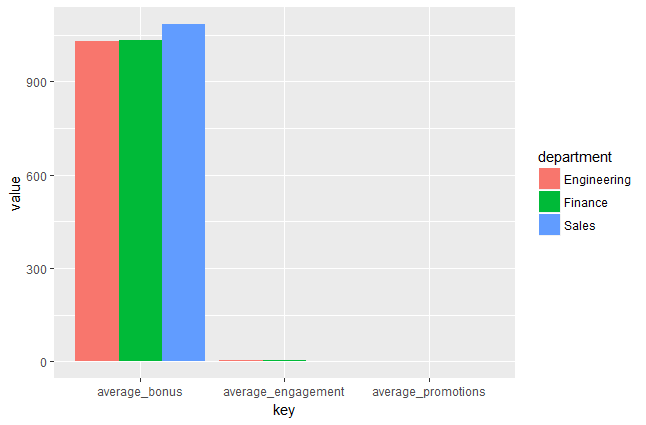
Adding color to bar charts
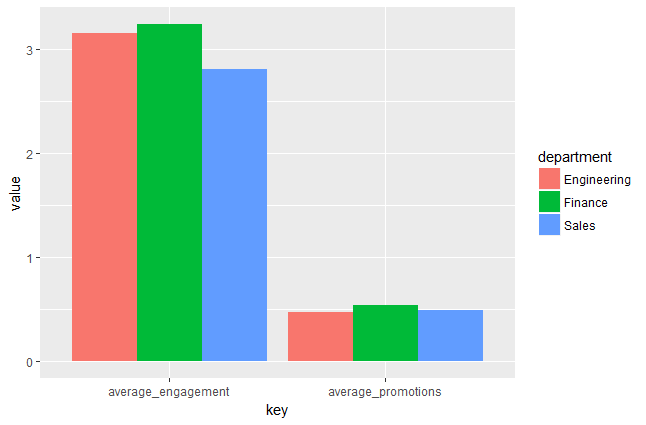
Side-by-side bar charts
HR Analytics: Exploring Employee Data in R
Ben Teusch
HR Analytics Consultant

