Omitted variable bias

HR Analytics: Exploring Employee Data in R

Ben Teusch

HR Analytics Consultant

When group compositions differ

Two groups of people

  • A: eats little to no meat
  • B: eats normal amount of meat
    • Group A gains weight

Conclusion: weight gain plans should exclude meat?

HR Analytics: Exploring Employee Data in R

When group compositions differ

Two groups of people

  • A: eats little to no meat
  • B: eats normal amount of meat
    • Group A gains weight
  • Omitted piece of data:
    • group A is made up of infants
    • group B is made up of adults
HR Analytics: Exploring Employee Data in R

Omitted variable bias

Omitted variable bias occurs when an omitted variable is correlated with:

  • the dependent variable, and
  • the way the groups are divided
HR Analytics: Exploring Employee Data in R

Visualizing group composition

HR Analytics: Exploring Employee Data in R

HR Analytics: Exploring Employee Data in R

100% stacked bar charts

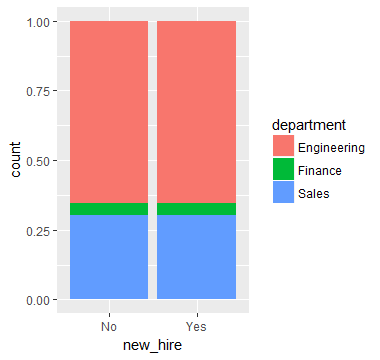
pay %>% 
  ggplot(aes(x = new_hire, fill = department)) +
  geom_bar(position = "fill")
HR Analytics: Exploring Employee Data in R

Let's practice!

HR Analytics: Exploring Employee Data in R

Preparing Video For Download...