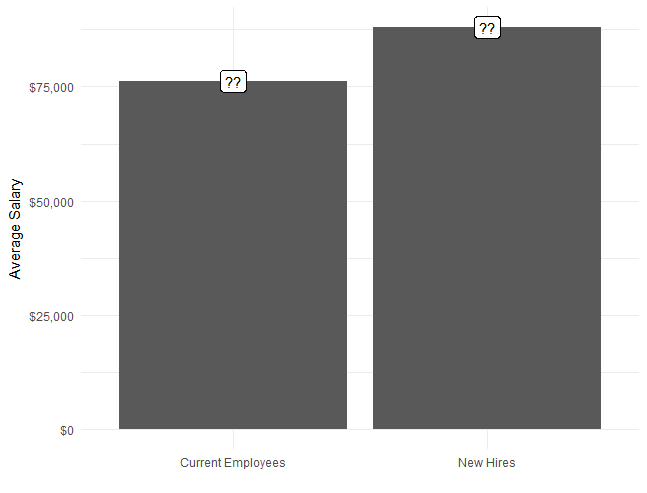
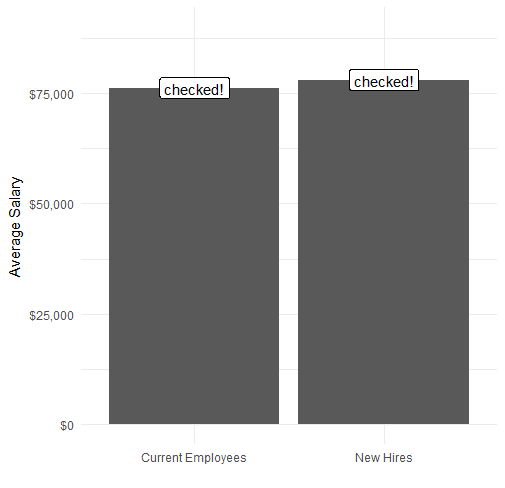
Paying new hires fairly
HR Analytics: Exploring Employee Data in R

Ben Teusch
HR Analytics Consultant


The data
head(pay)
# A tibble: 6 x 5
  employee_id  department    salary new_hire job_level
        <int>       <chr>     <dbl>    <chr>     <chr>
1           1       Sales 103263.64       No  Salaried
2           2 Engineering  80708.64       No    Hourly
3           4 Engineering  60737.05      Yes    Hourly
4           5 Engineering  99116.32      Yes  Salaried
5           7 Engineering  51021.64       No    Hourly
6           8 Engineering  98399.87       No  Salaried
chisq.test(survey$in_sales, survey$disengaged)
    Pearson's Chi-squared test with Yates' continuity correction
data:  survey$in_sales and survey$disengaged
X-squared = 25.524, df = 1, p-value = 4.368e-07
chisq.test(survey$in_sales, survey$disengaged) %>%
  tidy()
  statistic      p.value parameter                         method
1  25.52441 4.368222e-07         1 Pearson's Chi-squared test ...
chisq.test(survey$in_sales, survey$disengaged) %>%
  tidy() %>%
  pull(p.value)
4.368222e-07
Let's practice!
HR Analytics: Exploring Employee Data in R

