Resampling को Monte Carlo simulation का एक खास रूप

Python में Monte Carlo Simulations

Izzy Weber

Curriculum Manager, DataCamp

Resampling को Monte Carlo simulation का एक खास रूप


Monte Carlo simulations

  • Probability distributions से sample लें
  • Distributions ज्ञात हों या मानकर चलें
  • सही distributions चुनने के लिए historical data या विशेषज्ञता पर निर्भर करें


Resampling

  • मौजूदा डेटा से random sampling करें
  • मौजूदा डेटा implicit probability distribution है
  • मानें कि डेटा representative है
Python में Monte Carlo Simulations

Resampling methods

  1. Sampling without replacement
    • Random sample निकालने में उपयोग
  2. Sampling with replacement (या bootstrapping)
    • लगभग किसी भी statistic के sampling distribution का अनुमान लगाने के लिए उपयोग
  3. Permutation
    • अक्सर दो समूहों की तुलना के लिए उपयोग
Python में Monte Carlo Simulations

Sampling without replacement

New England के छह राज्यों में से दो अलग-अलग राज्यों को random रूप से चुनें

import random
def two_random_ne_states():

ne_states=["Maine", "Vermont", "New Hampshire", "Massachusetts", "Connecticut", "Rhode Island"]
return(random.sample(ne_states, 2))


two_random_ne_states()
['Massachusetts', 'Connecticut']
['New Hampshire', 'Maine']
Python में Monte Carlo Simulations

Bootstrapping

NBA खिलाड़ियों की औसत ऊँचाई के लिए 95% confidence interval का अनुमान लगाएँ

import random
import numpy as np

nba_heights = [196, 191, 198, 216, 188, 185, 211, 201,
               188, 191, 201, 208, 191, 183, 196]
simu_heights = []

for i in range(1000): bootstrap_sample = random.choices(nba_heights, k=15) simu_heights.append(np.mean(bootstrap_sample))
upper = np.quantile(simu_heights, 0.975) lower = np.quantile(simu_heights, 0.025) print([np.mean(simu_heights), lower, upper])
[196.26666666666668, 191.8, 201.2]
Python में Monte Carlo Simulations

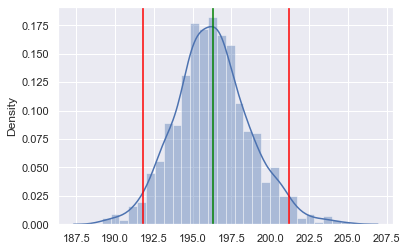
Bootstrap परिणामों का विज़ुअलाइज़ेशन

Plotting libraries:

  • seaborn
  • matplotlib
import seaborn as sns
import matplotlib.pyplot as plt

sns.displot(simu_heights)
plt.axvline(191.8, color="red")
plt.axvline(201.2, color="red")
plt.axvline(196.3, color="green")


simulated heights का distribution plot

Python में Monte Carlo Simulations

Permutation

NBA खिलाड़ियों और US पुरुषों की ऊँचाई के औसत अंतर के 95% confidence interval का अनुमान लगाएँ

us_heights = [165, 185, 179, 187, 193, 180, 178, 179, 171, 176, 
              169, 160, 140, 199, 176, 185, 175, 196, 190, 176]
nba_heights = [196, 191, 198, 216, 188, 185, 211, 201, 188, 191, 201, 208, 191, 183, 196]

all_heights = us_heights + nba_heights
simu_diff = [] for i in range(1000): perm_sample = np.random.permutation(all_heights) perm_nba, perm_adult = perm_sample[0:15], perm_sample[15:35]
perm_diff = np.mean(perm_nba) - np.mean(perm_adult) simu_diff.append(perm_diff)
Python में Monte Carlo Simulations

Permutation परिणाम

NBA और अमेरिकी वयस्क पुरुषों की ऊँचाइयों के औसत में अंतर:

np.mean(nba_heights) - np.mean(us_adult_height)
18.31666666666669

दो random सूचियों की permutation के 95% confidence interval:

upper = np.quantile(simu_diff, 0.975)
lower = np.quantile(simu_diff, 0.025)
print([lower, upper])
[-10.033333333333331, 10.033333333333331]
Python में Monte Carlo Simulations

Permutation परिणामों का विज़ुअलाइज़ेशन

sns.distplot(simu_diff)
plt.axvline(-10.03, color="red")
plt.axvline(10.03, color="red")
plt.axvline(18.32, color="green")
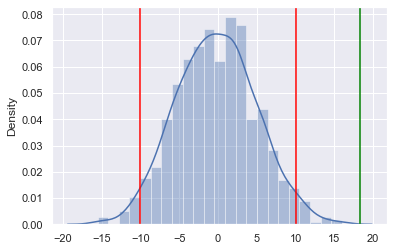
simulated heights का distribution plot

Python में Monte Carlo Simulations

अभ्यास करते हैं!

Python में Monte Carlo Simulations

Preparing Video For Download...