सिमुलेशन के परिणामों का विज़ुअलाइज़ेशन

Python में Monte Carlo Simulations

Izzy Weber

Curriculum Manager, DataCamp

Monte Carlo simulations से प्रश्नों के उत्तर

हर प्रेडिक्टर के पहले क्वार्टाइल की तुलना में चौथे क्वार्टाइल में आने वालों के लिए y के प्रेडिक्टेड मानों में कितना अंतर है?

Python में Monte Carlo Simulations

सिम्युलेटेड परिणामों से शुरुआत

df_summary.head()
|   | age       | bmi       | bp         | tc         | ldl        | hdl       | tch      | ltg      | glu        | predicted_y |
|---|-----------|-----------|------------|------------|------------|-----------|----------|----------|------------|-------------|
| 0 | 54.491842 | 32.512362 | 82.131464  | 203.075420 | 114.043050 | 44.820017 | 5.137683 | 5.254633 | 100.815909 | 209.297688  |
| 1 | 66.380490 | 29.380708 | 98.810054  | 136.474760 | 68.457982  | 51.691298 | 3.455412 | 4.572478 | 96.117969  | 177.081339  |
| 2 | 59.003285 | 27.015225 | 92.195168  | 242.796424 | 126.541644 | 86.050629 | 2.423928 | 4.640063 | 87.485747  | 123.192425  |
| 3 | 34.803821 | 20.961365 | 86.852597  | 168.762268 | 110.113823 | 53.158621 | 3.925988 | 4.080205 | 79.187999  | 84.284908   |
| 4 | 56.732615 | 32.682115 | 118.384860 | 226.152964 | 136.838283 | 46.467736 | 4.376397 | 5.374001 | 104.184429 | 244.900141  |
Python में Monte Carlo Simulations

हमारा प्रश्न सुलझाना

dic_diffs = {}
for var in ["age", "bmi", "bp", "tc", "ldl", "hdl", "tch", "ltg", "glu"]:
    var_q25 = np.quantile(df_summary[var], 0.25)
    var_q75 = np.quantile(df_summary[var], 0.75)

q75_outcome = np.mean(df_summary[(df_summary[var] > var_q75)]["predicted_y"]) q25_outcome = np.mean(df_summary[(df_summary[var] < var_q25)]["predicted_y"]) y_diff = q75_outcome - q25_outcome
dic_diffs[var] = [y_diff]
df_diffs = pd.DataFrame.from_dict(dic_diffs) df_diffs.head()
      age      bmi      bp      tc     ldl     hdl     tch      ltg     glu
0  36.721  114.462  87.101  42.625  35.413 -77.653  82.835  105.611  74.744
Python में Monte Carlo Simulations

1,000 बार सिमुलेशन

df_diffs.head()
       age      bmi      bp      tc     ldl     hdl     tch      ltg     glu
0   30.045  108.973  81.107  36.728  31.060 -75.885  79.829  101.231  67.215
1   36.860  112.486  86.164  39.596  33.970 -71.609  77.367  100.964  72.301
2   30.387  110.651  79.972  44.655  39.583 -74.377  82.354  103.808  71.804
3   35.047  113.609  83.241  34.706  23.764 -75.798  83.070  102.119  75.230
4   31.050  109.022  81.727  41.590  31.136 -73.955  80.866  101.668  74.225
  • इस DataFrame में 1,000 पंक्तियाँ हैं: 1,000 simulations में हर सेट के mean difference के लिए एक पंक्ति
Python में Monte Carlo Simulations

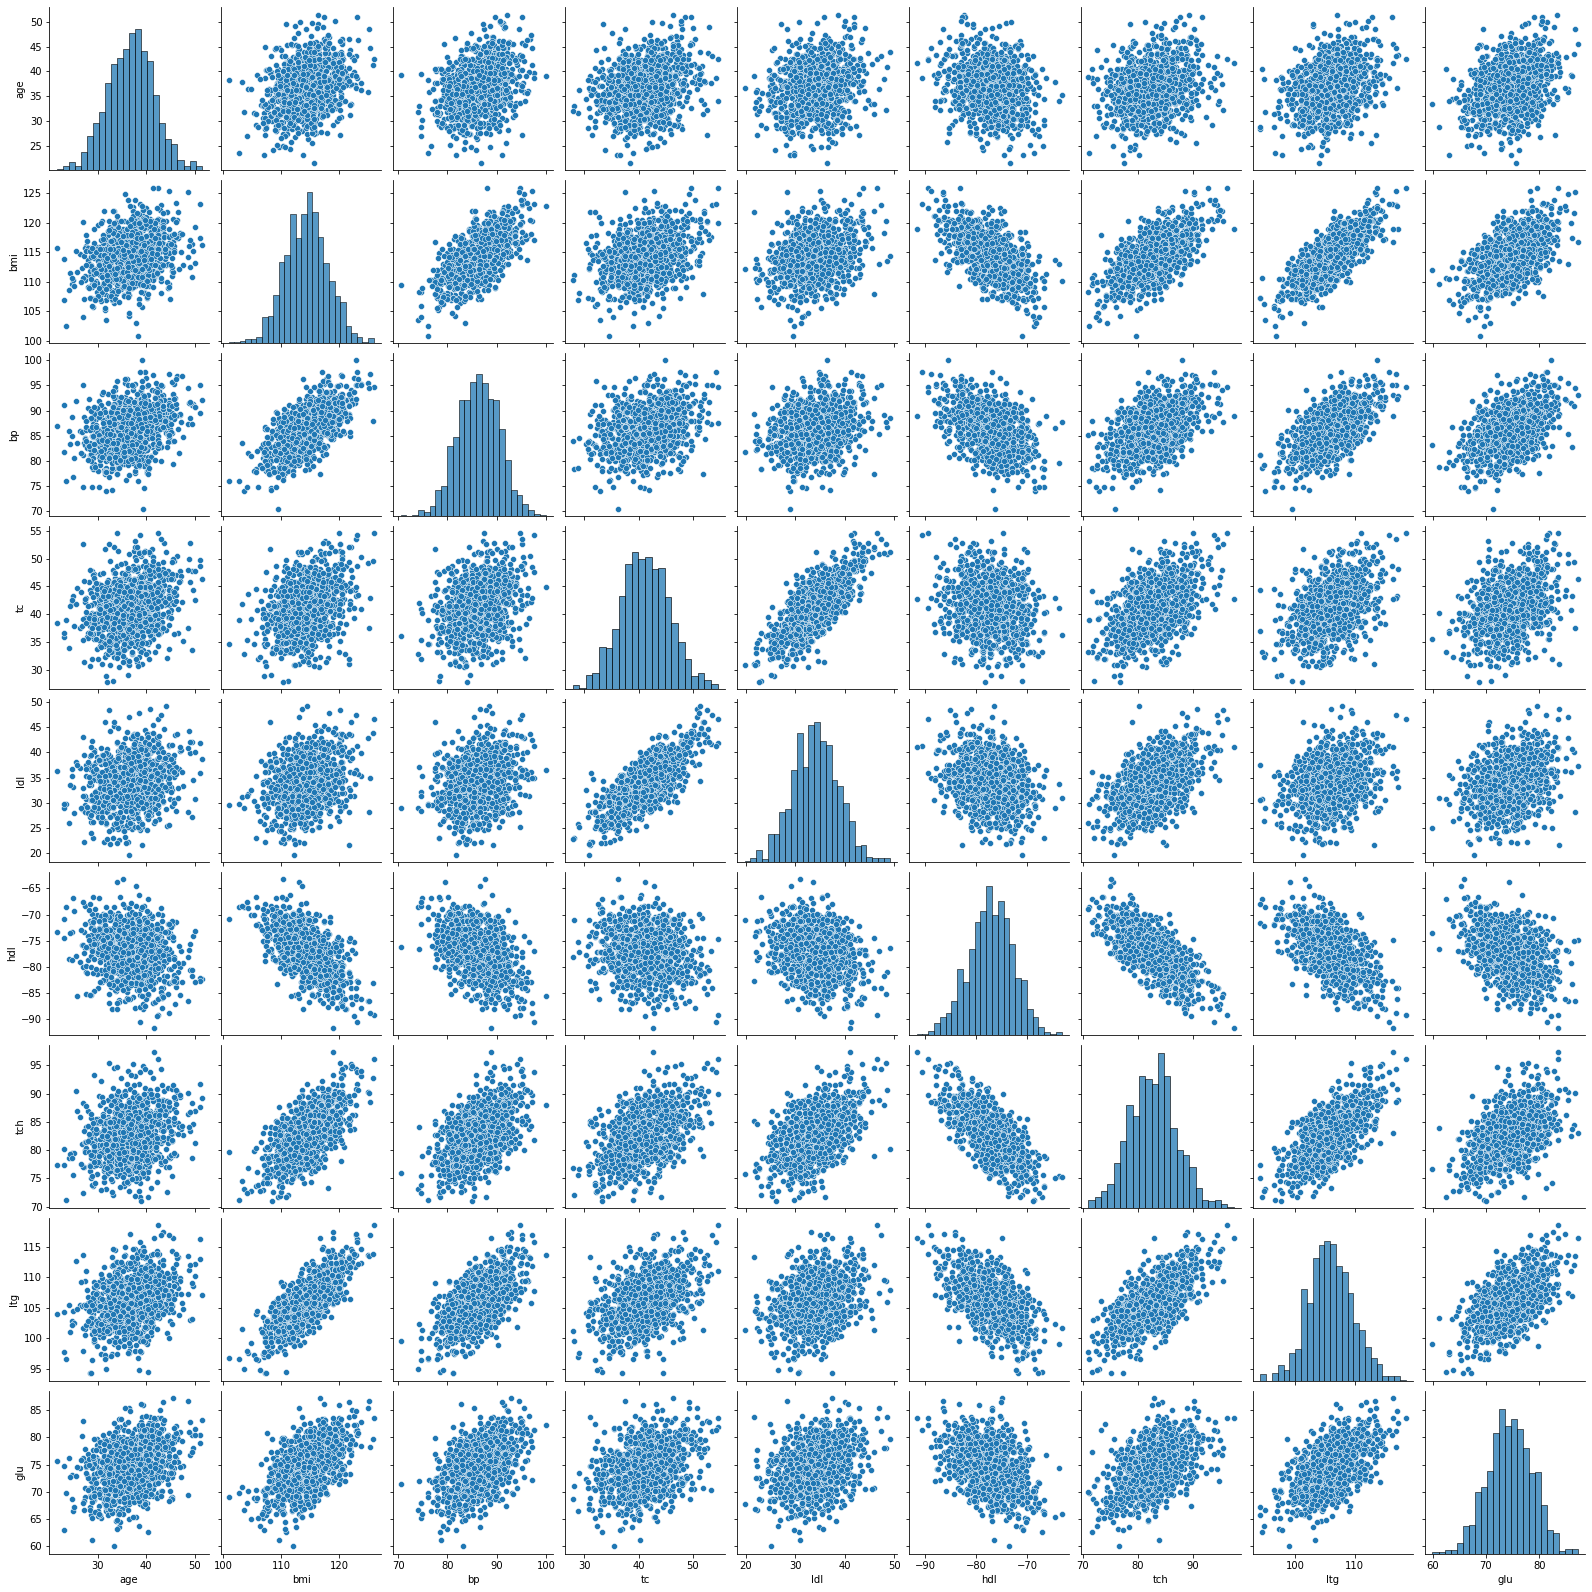
Pairplot

sns.pairplot(df_diffs)

df_diffs का एक पेयरप्लॉट

Python में Monte Carlo Simulations

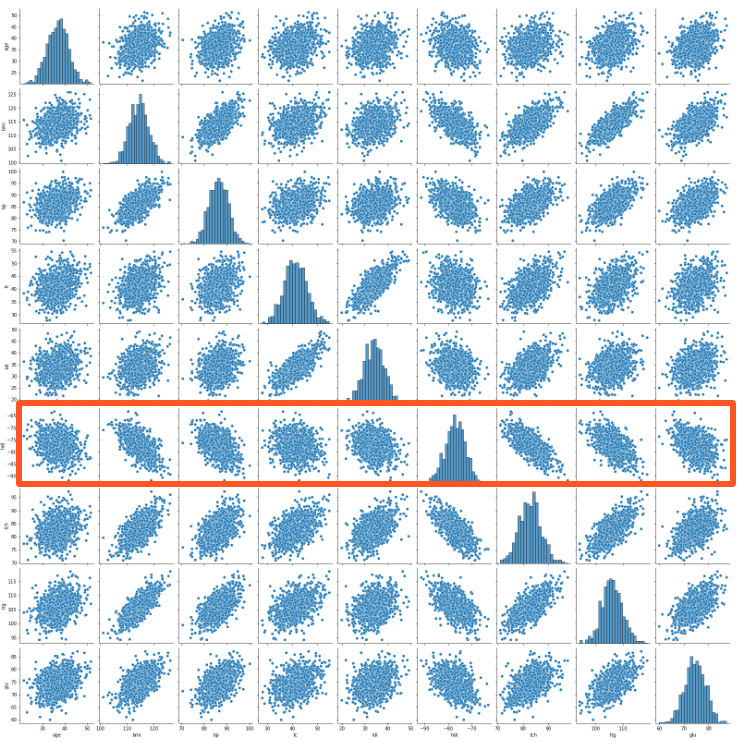
Pairplot

sns.pairplot(df_diffs)

hdl हाइलाइट किया हुआ पेयरप्लॉट

Python में Monte Carlo Simulations

Clustermap

sns.clustermap(df_diffs.corr())

df_diffs के correlations का एक क्लस्टरमैप

Python में Monte Carlo Simulations

Long format में बदलना

  • Long format में DataFrames में अक्सर दो कॉलम होते हैं: एक वैरिएबल का नाम और दूसरा उसका मान
df_diffs_long=df_diffs.melt(value_name="y_diff", 
                            value_vars=["age", "bmi", "bp", "tc", "ldl", "hdl",
                                         "tch", "ltg", "glu"])
df_diffs_long.head()
    variable        y_diff
0   age             30.045
1   age             36.860
2   age             30.387
3   age             35.047
4   age             31.050
Python में Monte Carlo Simulations

Boxplot

sns.boxplot(x="variable", y="y_diff", data=df_diffs_long)

df_diffs_long का एक बॉक्स प्लॉट

Python में Monte Carlo Simulations

अभ्यास करते हैं!

Python में Monte Carlo Simulations

Preparing Video For Download...