सारांश सांख्यिकी

Python में Monte Carlo Simulations

Izzy Weber

Curriculum Manager, DataCamp

Age outcomes

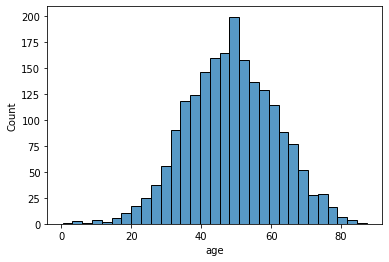
पहले और चौथे आयु क्वांटाइल में लोगों के outcomes में क्या अंतर है? सिम्युलेटेड परिणामों में Age वैरिएबल का हिस्टोग्राम
Python में Monte Carlo Simulations

Age outcomes

print(np.quantile(df_summary["age"], 0.25))
print(np.quantile(df_summary["age"], 0.75))
39.78584463094688
57.52092642086441
Python में Monte Carlo Simulations

Age outcomes

age_q25 = np.quantile(df_summary["age"], 0.25)
age_q75 = np.quantile(df_summary["age"], 0.75)


mean_age_q75_outcome = np.mean(df_summary[df_summary["age"] > age_q75]["predicted_y"]) mean_age_q25_outcome = np.mean(df_summary[df_summary["age"] < age_q25]["predicted_y"])
mean_age_q75_outcome - mean_age_q25_outcome
34.09429663553621
Python में Monte Carlo Simulations

Age और bmi के आधार पर outcome का अंतर

  • bmi और age के पहले व चौथे क्वांटाइल में outcomes का अंतर क्या है?
  • इस अंतर के लिए 95 प्रतिशत confidence interval और standard deviation क्या है?
Python में Monte Carlo Simulations

Age और bmi के आधार पर outcome का अंतर

y_diffs = []
for i in range(1000):
    simulation_results = st.multivariate_normal.rvs(mean=mean_dia, size=1000, cov=cov_dia)
    df_results = pd.DataFrame(simulation_results, columns=["age", "bmi", "bp", "tc", "ldl", 
                                                           "hdl", "tch", "ltg", "glu"])

predicted_y = regr_model.predict(df_results) df_y = pd.DataFrame(predicted_y, columns=["predicted_y"]) df_sum = pd.concat([df_results, df_y], axis=1)
age_q25 = np.quantile(df_sum["age"], 0.25) age_q75 = np.quantile(df_sum["age"], 0.75) bmi_q25 = np.quantile(df_sum["bmi"], 0.25) bmi_q75 = np.quantile(df_sum["bmi"], 0.75)
q75_outcome = np.mean(df_sum[(df_sum["bmi"] > bmi_q75) & (df_sum["age"] > age_q75)]["predicted_y"]) q25_outcome = np.mean(df_sum[(df_sum["bmi"] < bmi_q25) & (df_sum["age"] < age_q25)]["predicted_y"])
y_diff = q75_outcome - q25_outcome y_diffs.append(y_diff)
Python में Monte Carlo Simulations

Age और bmi के आधार पर outcome का अंतर

  • Mean:
    np.mean(y_diffs)
    
132.4948511247819
  • 95% confidence interval:
    np.quantile(y_diffs,0.025)
    
120.73340800299707
np.quantile(y_diffs,0.975)
144.1344994507557
  • Standard deviation:
    np.std(y_diffs)
    
5.9322225537128
  • परिणामों का हिस्टोग्राम:
    sns.histplot(y_diffs)
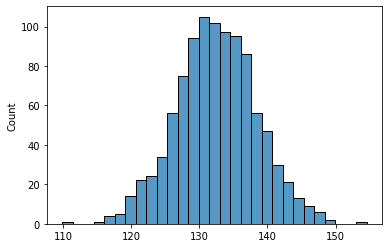
    
    y_diffs का हिस्टोग्राम
Python में Monte Carlo Simulations

अभ्यास करते हैं!

Python में Monte Carlo Simulations

Preparing Video For Download...