आउटलायर डिटेक्शन के लिए टाइम सीरीज़ डिकम्पोज़िशन

Python में Anomaly Detection

Bekhruz (Bex) Tuychiev

Kaggle Master, Data Science Content Creator

सीज़नैलिटी
  • टाइम सीरीज़ में दोहराते पैटर्न
  • फिक्स्ड फ़्रीक्वेंसी होती है:
    • hourly
    • daily
    • weekly
    • monthly, आदि
  • उदाहरण:
    • दैनिक तापमान
    • आइसक्रीम बिक्री
Python में Anomaly Detection

सीज़नैलिटी

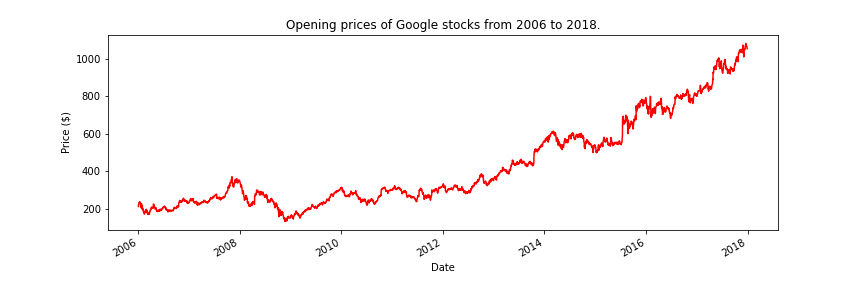
Google स्टॉक्स के ओपनिंग प्राइसेज़ का लाइन प्लॉट.

Python में Anomaly Detection

seasonal_decompose

from statsmodels.tsa.seasonal import seasonal_decompose

results = seasonal_decompose(google['Open'], period=365)

print(results)
<statsmodels.tsa.seasonal.DecomposeResult object at 0x7f0a67fac820>
Python में Anomaly Detection

सीज़नैलिटी प्लॉट करना

results.seasonal.plot(color="red", figsize=(12, 4))
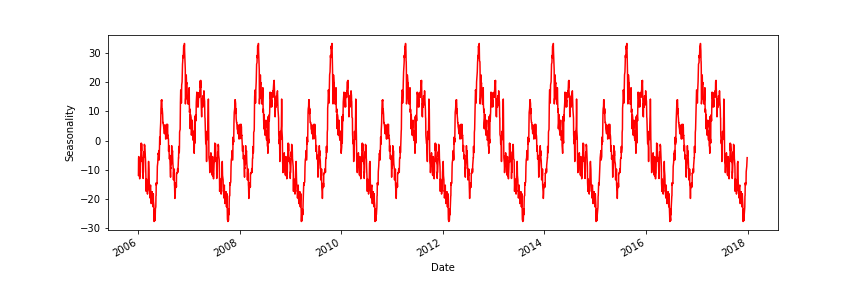
Google स्टॉक्स की ओपनिंग प्राइसेज़ की सीज़नैलिटी का प्लॉट

Python में Anomaly Detection

सीज़नैलिटी के उदाहरण

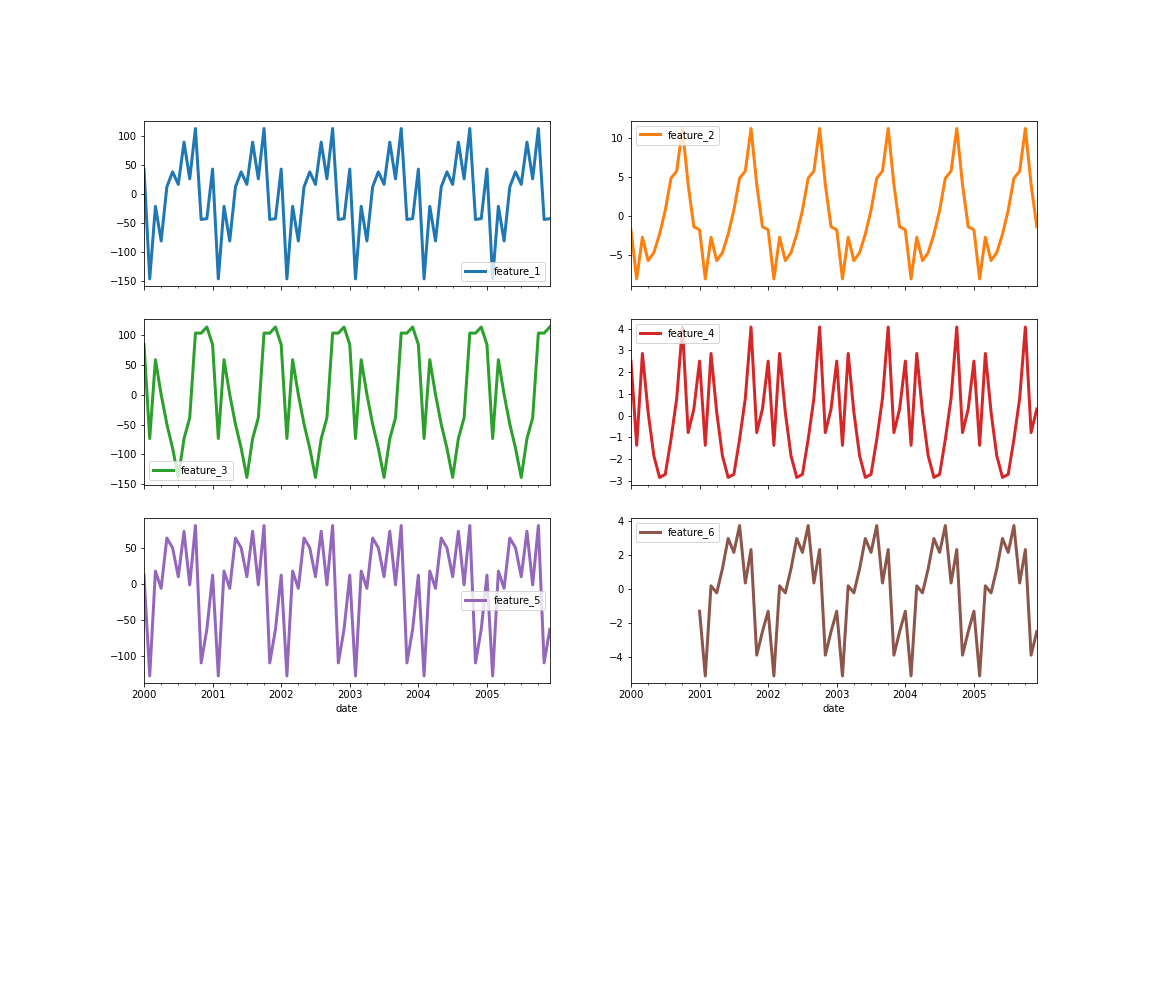
टाइम सीरीज़ सीज़नैलिटी के उदाहरण.

Python में Anomaly Detection

स्टॉक्स का शुरुआती प्लॉट

Google स्टॉक्स की ओपनिंग प्राइसेज़ का शुरुआती प्लॉट

Python में Anomaly Detection

ट्रेंड

results.trend.plot(color="red", figsize=(12, 4))

Python में Anomaly Detection

ट्रेंड के उदाहरण

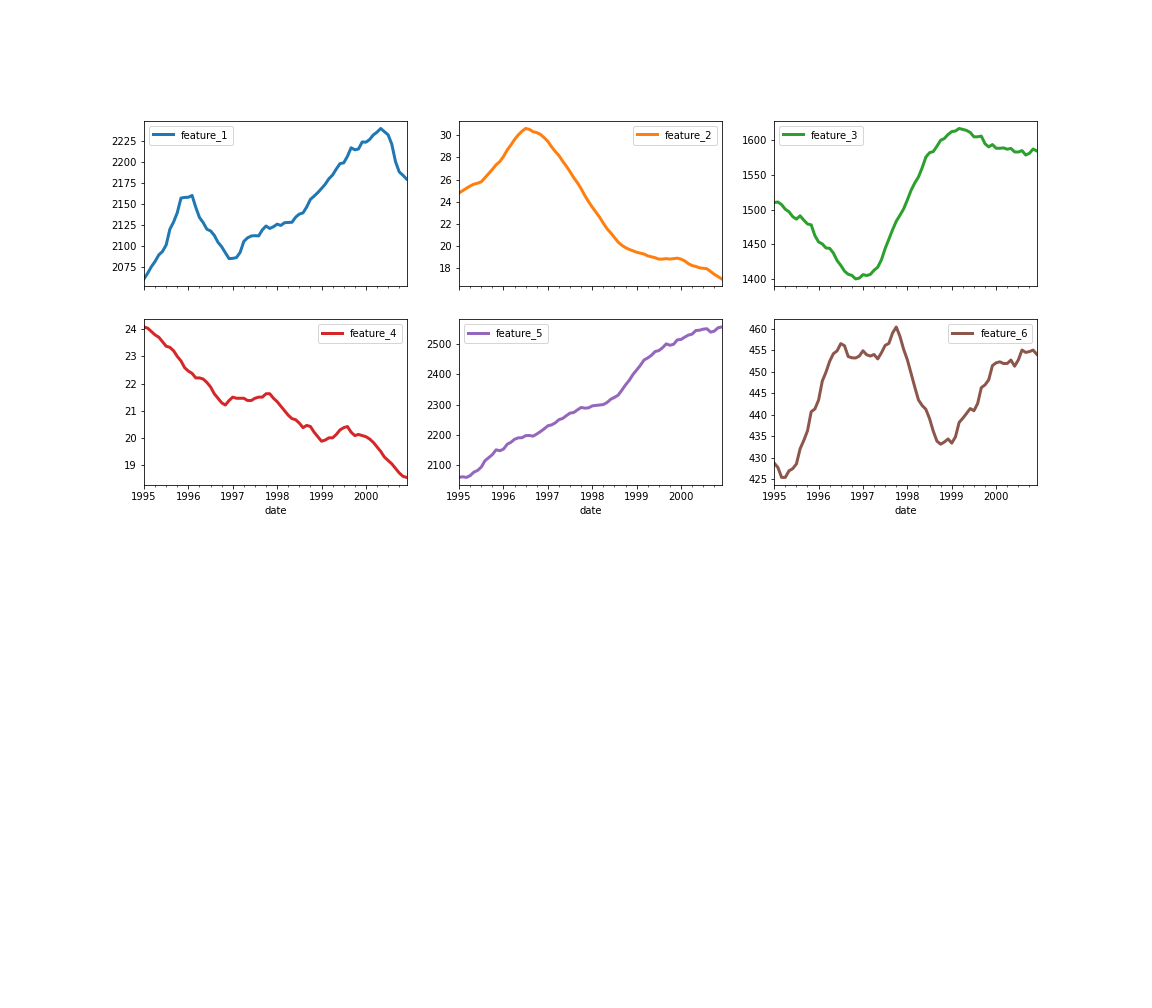
टाइम सीरीज़ ट्रेंड्स के उदाहरण.

Python में Anomaly Detection

रेजिडुअल्स

results.resid.plot(color="red", figsize=(12, 4))
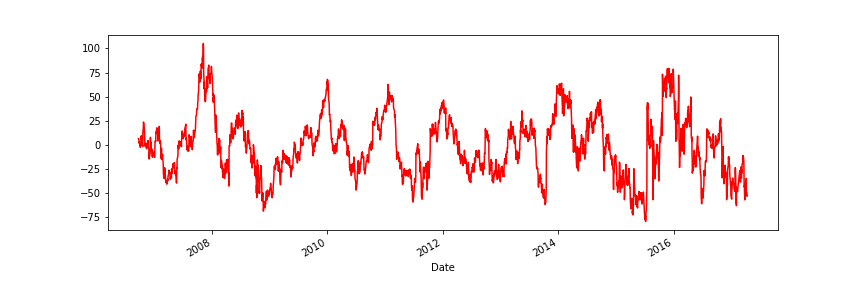
Google स्टॉक्स की ओपनिंग प्राइसेज़ के रेजिडुअल्स का प्लॉट.

Python में Anomaly Detection

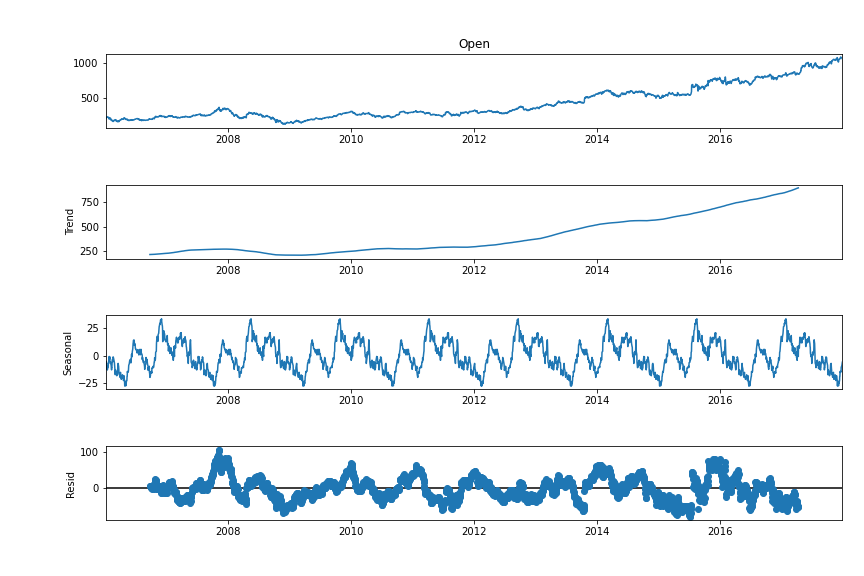
डिकम्पोज़िशन

figure = results.plot()

figure.set_figwidth(12)
figure.set_figheight(8)

टाइम सीरीज़ के तीनों कॉम्पोनेन्ट्स का विज़ुअलाइज़ेशन.

Python में Anomaly Detection

क्लासिफायर फिट करना

# Extract and reshape residuals
results = seasonal_decompose(google['Volume'], period=365)
residuals = results.resid
residuals = residuals.values.reshape(-1, 1)


# Fit MAD mad = MAD().fit(residuals)
# Find the outliers is_outlier = mad.labels_ == 1 outliers = google[is_outlier] print(len(outliers))
81
Python में Anomaly Detection

अभ्यास करते हैं!

Python में Anomaly Detection

Preparing Video For Download...