आउटलायर-रोबस्ट फीचर स्केलिंग

Python में Anomaly Detection

Bekhruz (Bex) Tuychiev

Kaggle Master, Data Science Content Creator

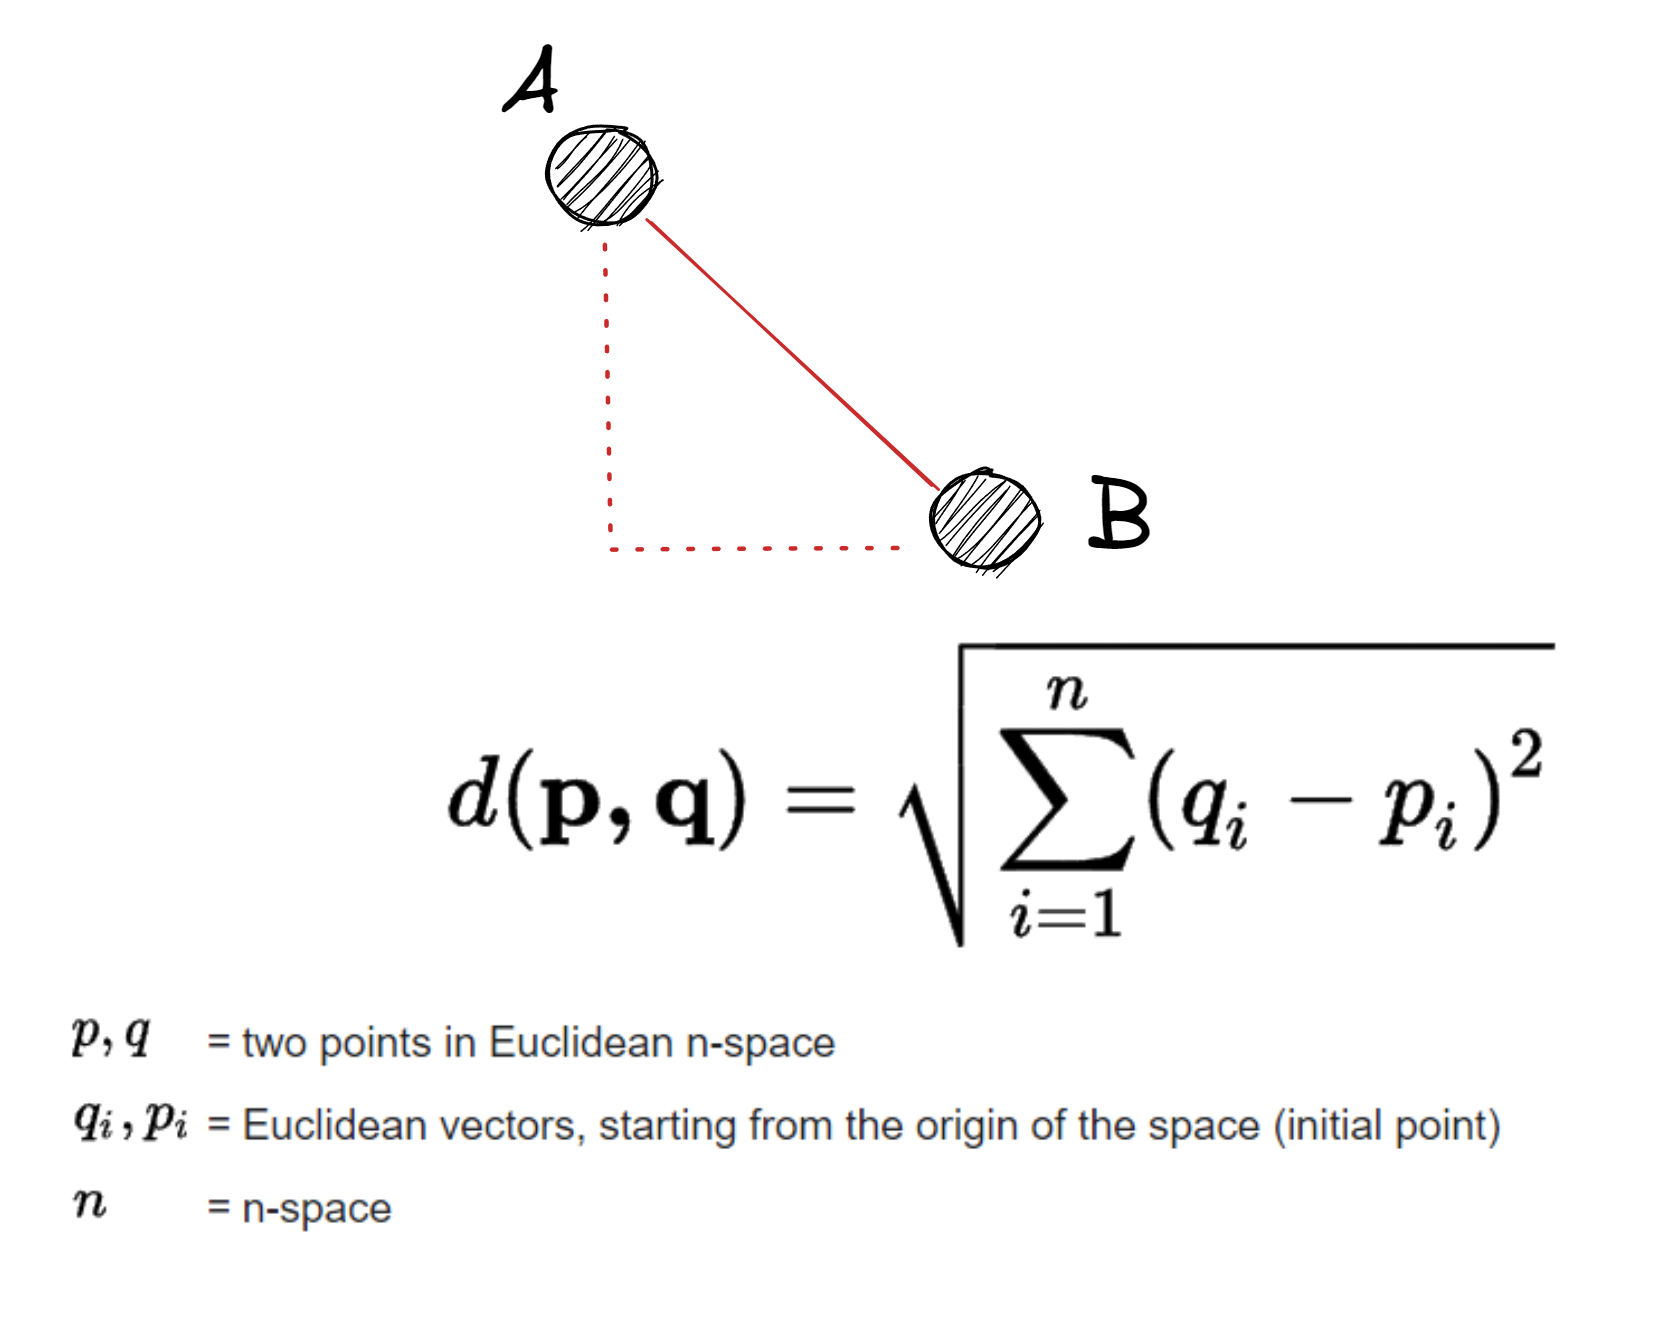
Euclidean दूरी
A = np.array([9, 1, 6])
B = np.array([25, 44, 85])


diffs = (B - A) ** 2
dist_AB = np.sqrt(np.sum(diffs)) print(dist_AB)
91.35644476444998

Euclidean दूरी निकालने का फ़ॉर्मूला और उसे दर्शाने वाला विज़ुअल.

Python में Anomaly Detection

SciPy में Euclidean

from scipy.spatial.distance import \
euclidean

dist_AB = euclidean(A, B)
dist_AB
91.35644476444998

Euclidean दूरी निकालने का फ़ॉर्मूला और उसे दर्शाने वाला विज़ुअल.

Python में Anomaly Detection

Standardization

  • Mean घटाकर STD से भाग दें
  • परिणाम: mean शून्य और STD 1
Python में Anomaly Detection

StandardScaler

from sklearn.preprocessing import StandardScaler

ss = StandardScaler()

# फीचर और टार्गेट निकालें X = males.drop("weightkg", axis=1) y = males[['weightkg']]
# Fit ss.fit(X)
Python में Anomaly Detection

Transform करना

X_transformed = ss.transform(X)

X_transformed[:5]
array([[-1.05174523],
       [-0.29289108],
       [ 1.3446363 ],
       [-1.21654894],
       [0.056451235]])
Python में Anomaly Detection

fit_transform

ss = StandardScaler()

X_transformed = ss.fit_transform(X)
Python में Anomaly Detection

QuantileTransformer

from sklearn.preprocessing import QuantileTransformer


# Init qt = QuantileTransformer() X = males.drop("weightkg", axis=1) y = males[['weightkg']]
X_transformed = qt.fit_transform(X) X_transformed.shape
(4082, 94)
Python में Anomaly Detection

कॉलम नाम सुरक्षित रखना

qt = QuantileTransformer()

X.loc[:, :] = qt.fit_transform(X)

X.head()

Ansur Males बॉडी माप डेटासेट के ट्रांसफॉर्म किए गए पहले पाँच रो.

Python में Anomaly Detection

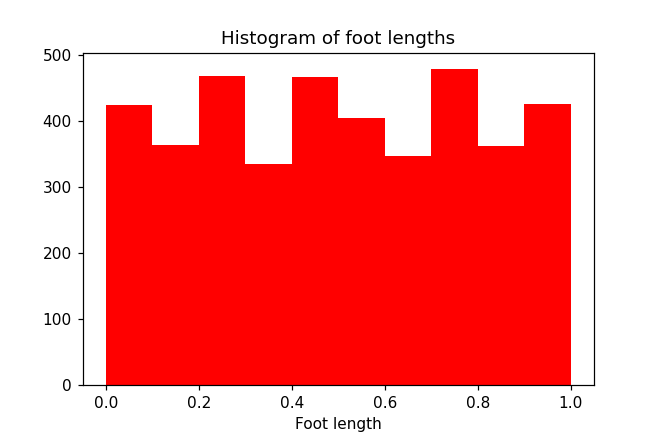
Uniform हिस्टोग्राम

plt.hist(X['footlength'], color='red')

plt.xlabel("Foot length")
plt.title("Histogram of foot lengths")

plt.show()

foot length कॉलम का हिस्टोग्राम जो uniform वितरण दिखाता है

Python में Anomaly Detection

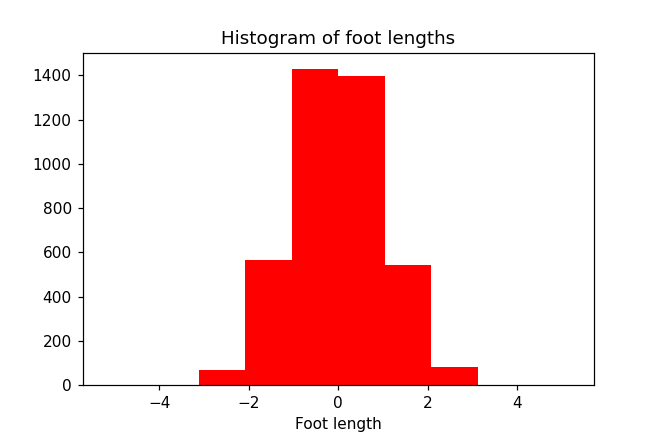
Normal हिस्टोग्राम

qt = QuantileTransformer(
  output_distribution='normal')

# ओवरराइड किए गए फीचर एरे को फिर बनाएं
X = males.drop("weightkg", axis=1)
X.loc[:, :] = qt.fit_transform(X)

plt.hist(X['footlength'], color='r')
plt.xlabel("Foot length")
plt.title("Histogram of foot lengths")

plt.show()

foot length कॉलम का हिस्टोग्राम जो लगभग normal वितरण दिखाता है

Python में Anomaly Detection

अभ्यास करते हैं!

Python में Anomaly Detection

Preparing Video For Download...