कोर्स में आपका स्वागत है!
R में संख्यात्मक डेटा के लिए Inference

Mine Cetinkaya-Rundel
Associate Professor of the Practice, Duke University
मैनहैटन में किराया
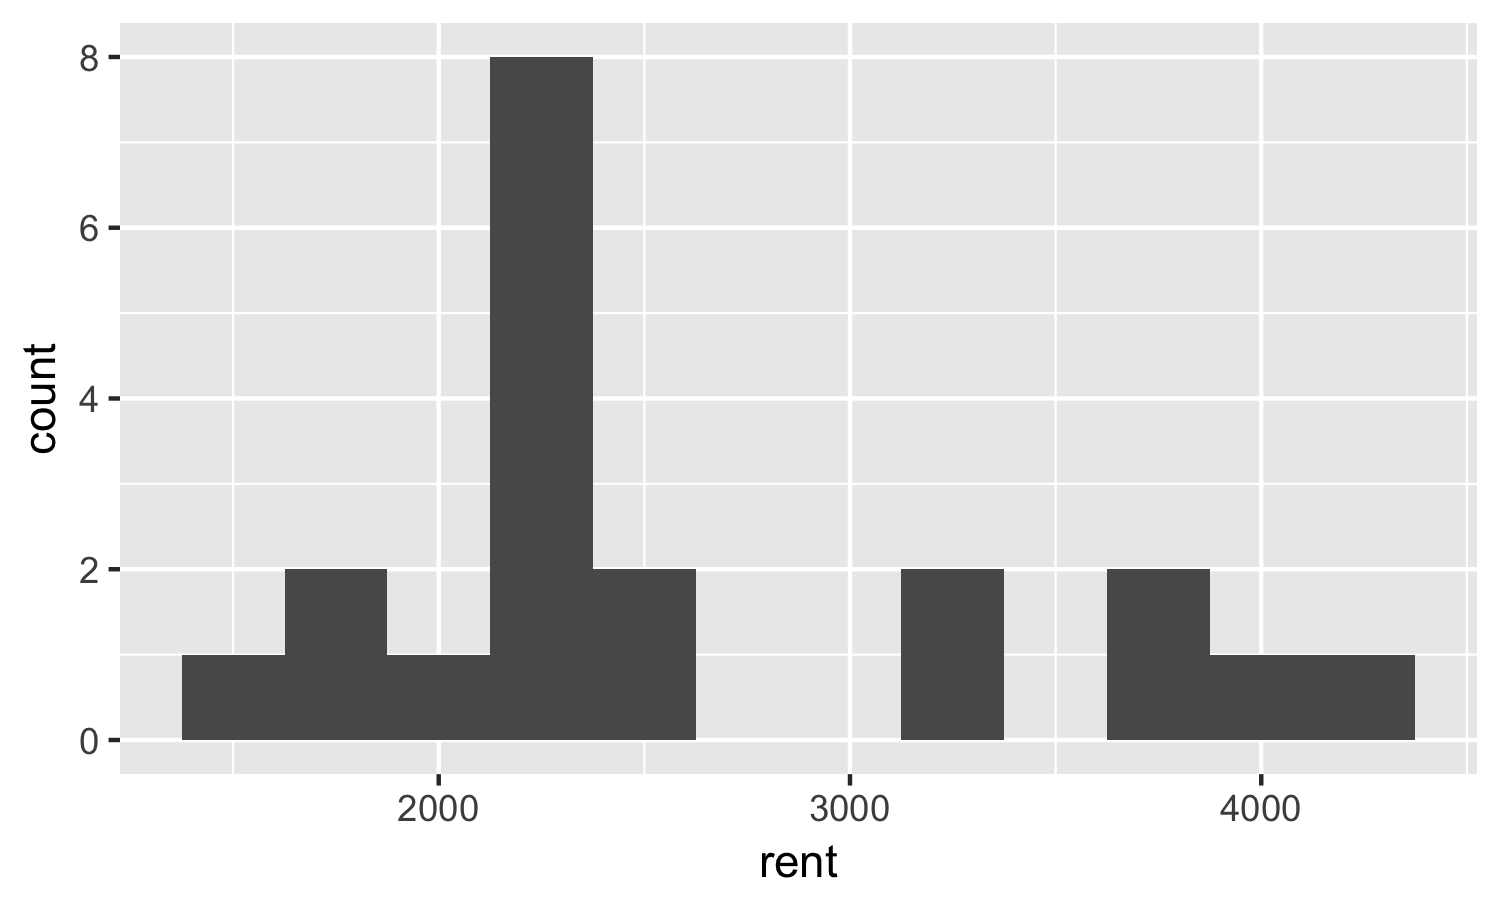
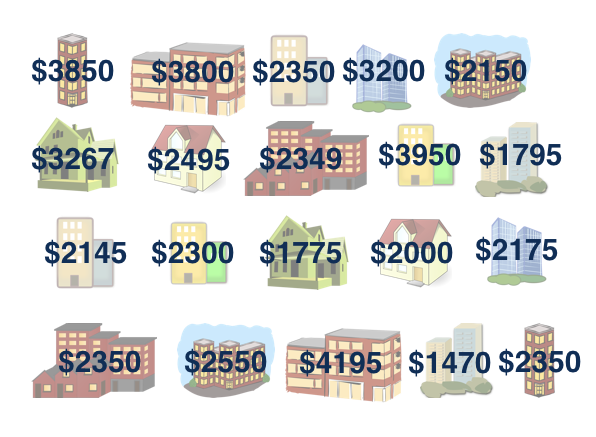
प्रेक्षित सैंपल
sample median = $2,350
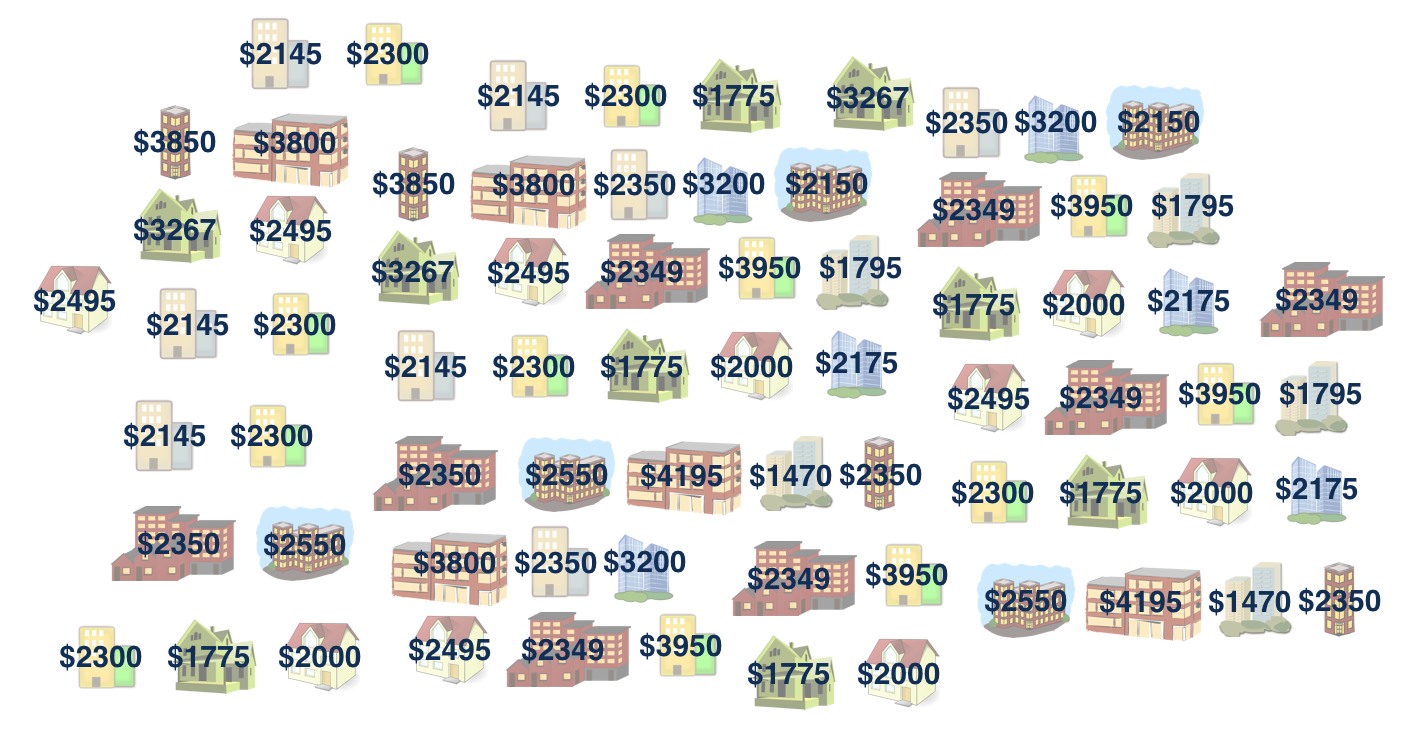
Bootstrap population
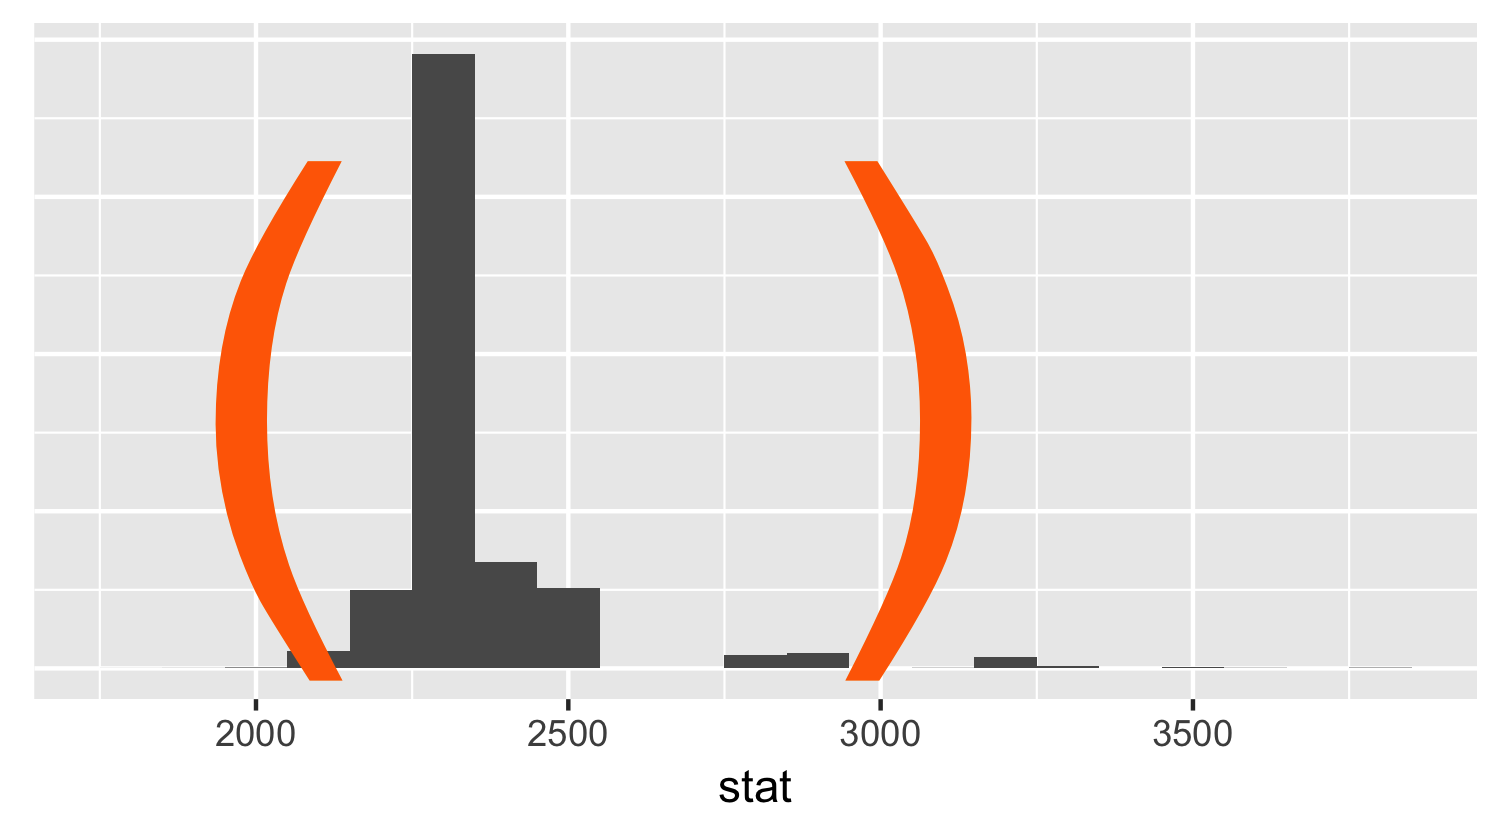
Bootstrap interval बनाना
library(infer)

___ %>%                               # data frame से शुरू करें
  specify(response = ___) %>%         # रुचि वाला वैरिएबल बताएँ
generate(reps = ___, type = "bootstrap") %>% # bootstrap samples जनरेट करें
calculate(stat = "___") # bootstrap statistic निकालें
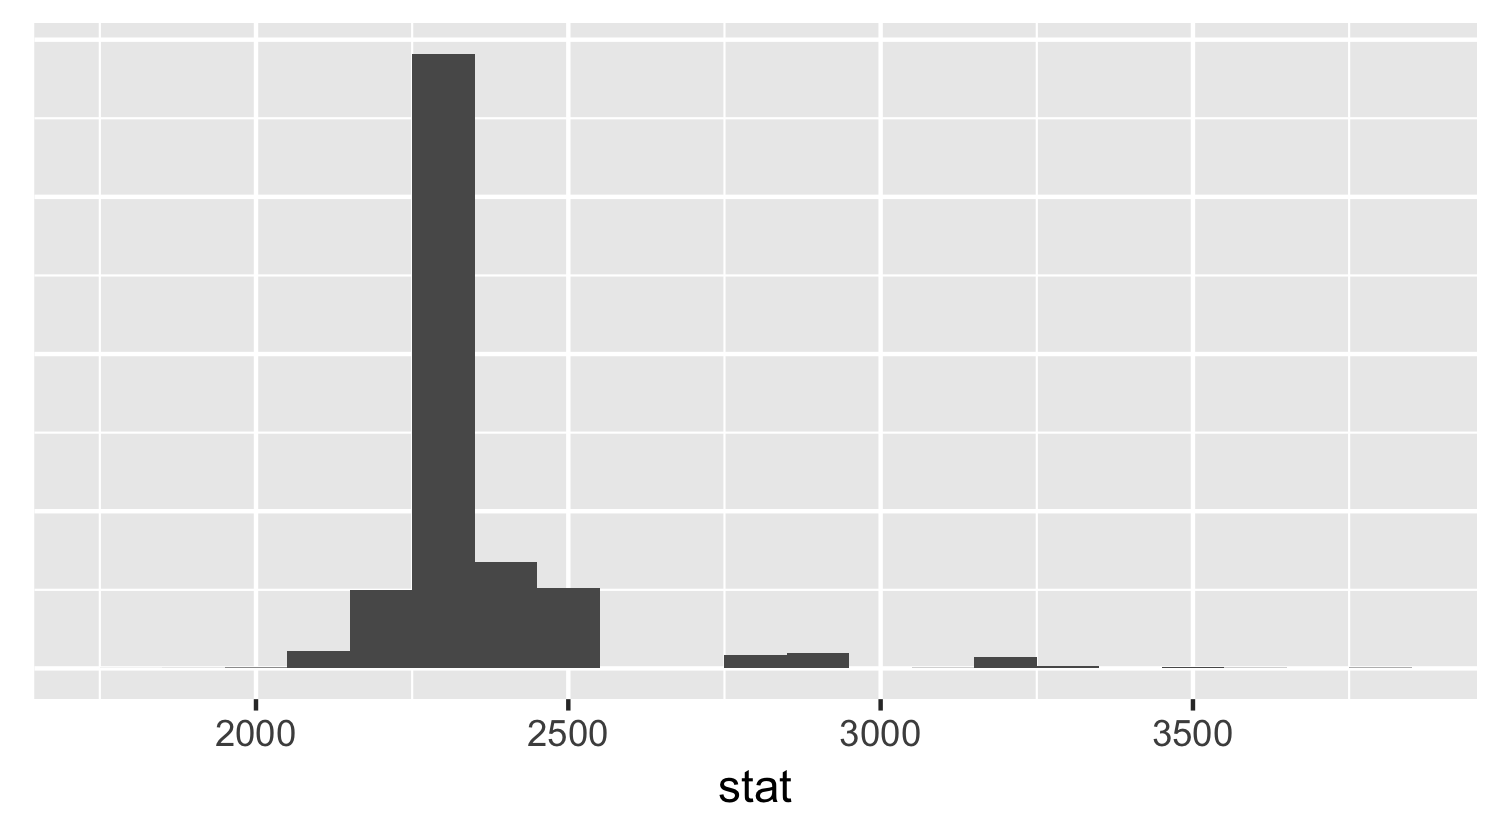
Bootstrap interval बनाना
library(infer)

___ %>%                               # data frame से शुरू करें
  specify(response = ___) %>%         # रुचि वाला वैरिएबल बताएँ
  generate(reps = ___, type = "bootstrap") %>%  # bootstrap samples जनरेट करें
calculate(stat = "___") # bootstrap statistic निकालें