Parallel coordinates plot

Python में Market Basket Analysis

Isaiah Hull

Visiting Associate Professor of Finance, BI Norwegian Business School

Parallel coordinates plot क्या है?
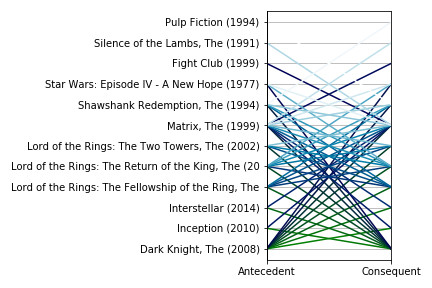
यह प्लॉट MovieLens डेटासेट पर आधारित एक parallel coordinates plot का उदाहरण दिखाता है.

Python में Market Basket Analysis

Parallel coordinate plots कब उपयोग करें


  • Parallel coordinates बनाम heatmap.
    • इंटेंसिटी जानकारी की ज़रूरत नहीं.
    • बस जानना है कि नियम मौजूद है या नहीं.
    • विज़ुअल क्लटर घटाना चाहते हैं.


  • Parallel coordinates बनाम scatterplot.
    • व्यक्तिगत नियम-स्तर की जानकारी चाहिए.
    • कई मेट्रिक्स में रुचि नहीं.
    • सिर्फ अंतिम नियम देखना चाहते हैं.
Python में Market Basket Analysis

डेटा तैयार करना


from mlxtend.frequent_patterns import association_rules, apriori

# Load the one-hot encoded data
onehot = pd.read_csv('datasets/movies_onehot.csv')
# Generate frequent itemsets
frequent_itemsets = apriori(onehot, min_support = 0.10, use_colnames = True, max_len = 2)

# Generate association rules
rules = association_rules(frequent_itemsets, metric = 'support', min_threshold = 0.00)
Python में Market Basket Analysis

नियमों को coordinates में बदलना

# Convert rules to coordinates.
rules['antecedent'] = rules['antecedents'].apply(lambda antecedent: list(antecedent)[0])
rules['consequent'] = rules['consequents'].apply(lambda consequent: list(consequent)[0])
rules['rule'] = rules.index
# Define coordinates and label
coords = rules[['antecedent','consequent','rule']]

# Print example
print(coords.head(1))
                antecedent        consequent  rule
0  Dark Knight, The (2008)  Inception (2010)     0
Python में Market Basket Analysis

Parallel coordinates plot बनाना


from pandas.plotting import parallel_coordinates

# Generate parallel coordinates plot
parallel_coordinates(coords, 'rule', colormap = 'ocean')
Python में Market Basket Analysis

Parallel coordinates plot बनाना

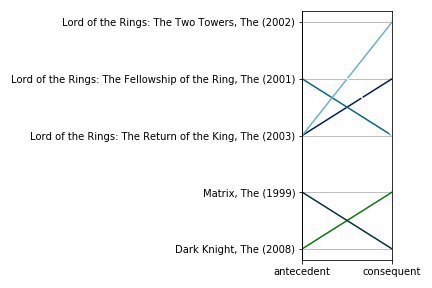
यह फ़िगर MovieLens डेटा पर आधारित एक parallel coordinates plot दिखाता है.

Python में Market Basket Analysis

Parallel coordinates plot को परिष्कृत करना
# Generate frequent itemsets
frequent_itemsets = apriori(onehot, min_support = 0.01, use_colnames = True, max_len = 2)

# Generate association rules
rules = association_rules(frequent_itemsets, metric = 'lift', min_threshold = 1.00)

# Generate coordinates and print example
coords = rules_to_coordinates(rules)

# Generate parallel coordinates plot
parallel_coordinates(coords, 'rule')
Python में Market Basket Analysis

Parallel coordinates plot को परिष्कृत करना

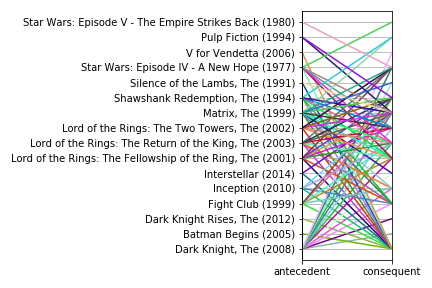
यह फ़िगर MovieLens डेटा पर आधारित एक parallel coordinates plot दिखाता है.

Python में Market Basket Analysis

अभ्यास करते हैं!

Python में Market Basket Analysis

Preparing Video For Download...