Cox मॉडल का विज़ुअलाइज़ेशन

R में Survival Analysis

Heidi Seibold

Statistician at LMU Munich

Cox मॉडल को विज़ुअलाइज़ करने के स्टेप्स

  • Cox मॉडल निकालें
  • सहपरिवर्तनीय संयोजन तय करें ("काल्पनिक मरीज")
  • सर्वाइवल कर्व्स निकालें
  • सर्वाइवल कर्व जानकारी वाला data.frame बनाएं
  • प्लॉट करें
R में Survival Analysis

स्टेप 1: Cox मॉडल निकालें

cxmod <- coxph(Surv(time, cens) ~ horTh + tsize, data = GBSG2)
  • सहपरिवर्तनीय संयोजन तय करें ("काल्पनिक मरीज")
    newdat <- expand.grid(
      horTh = levels(GBSG2$horTh),
      tsize = quantile(GBSG2$tsize, probs = c(0.25, 0.5, 0.75))   )
    rownames(newdat) <- letters[1:6]
    newdat
    
  horTh tsize
a    no    20
b   yes    20
c    no    25
...
R में Survival Analysis

स्टेप 2: सर्वाइवल कर्व्स निकालें

cxsf <- survfit(cxmod, data = GBSG2, newdata = newdat, conf.type = "none")

str(cxsf)
List of 10
$ n       : int 686
$ time    : num [1:574] 8 15 16 17 18 29 42 46 57 63 ...
$ n.risk  : num [1:574] 686 685 684 683 681 680 679 678 677 676 ...
$ n.event : num [1:574] 0 0 0 0 0 0 0 0 0 0 ...
$ n.censor: num [1:574] 1 1 1 2 1 1 1 1 1 1 ...
$ surv    : num [1:574, 1:6] 1 1 1 1 1 1 1 1 1 1 ...
..- attr(*, "dimnames")=List of 2
.. ..$ : NULL
.. ..$ : chr [1:6] "a" "b" "c" "d" ...
$ type    : chr "right"
$ cumhaz  : num [1:574, 1:6] 0 0 0 0 0 0 0 0 0 0 ...
$ std.err : num [1:574, 1:6] 0 0 0 0 0 0 0 0 0 0 ...
$ call    : language survfit(formula = cxmod, newdata = newdat, conf.type = "none", data = GBSG2)
  - attr(*, "class")= chr [1:2] "survfit.cox" "survfit"
R में Survival Analysis

स्टेप 3: सर्वाइवल कर्व जानकारी वाला data.frame बनाएँ

surv_cxmod0 <- surv_summary(cxsf)
head(surv_cxmod0)
   time n.risk n.event n.censor surv std.err upper lower strata
 1    8    686       0        1    1       0    NA    NA      a
 2   15    685       0        1    1       0    NA    NA      a
 3   16    684       0        1    1       0    NA    NA      a
 4   17    683       0        2    1       0    NA    NA      a
 5   18    681       0        1    1       0    NA    NA      a
 6   29    680       0        1    1       0    NA    NA      a
surv_cxmod <- cbind(surv_cxmod0,
                    newdat[as.character(surv_cxmod0$strata), ])
R में Survival Analysis

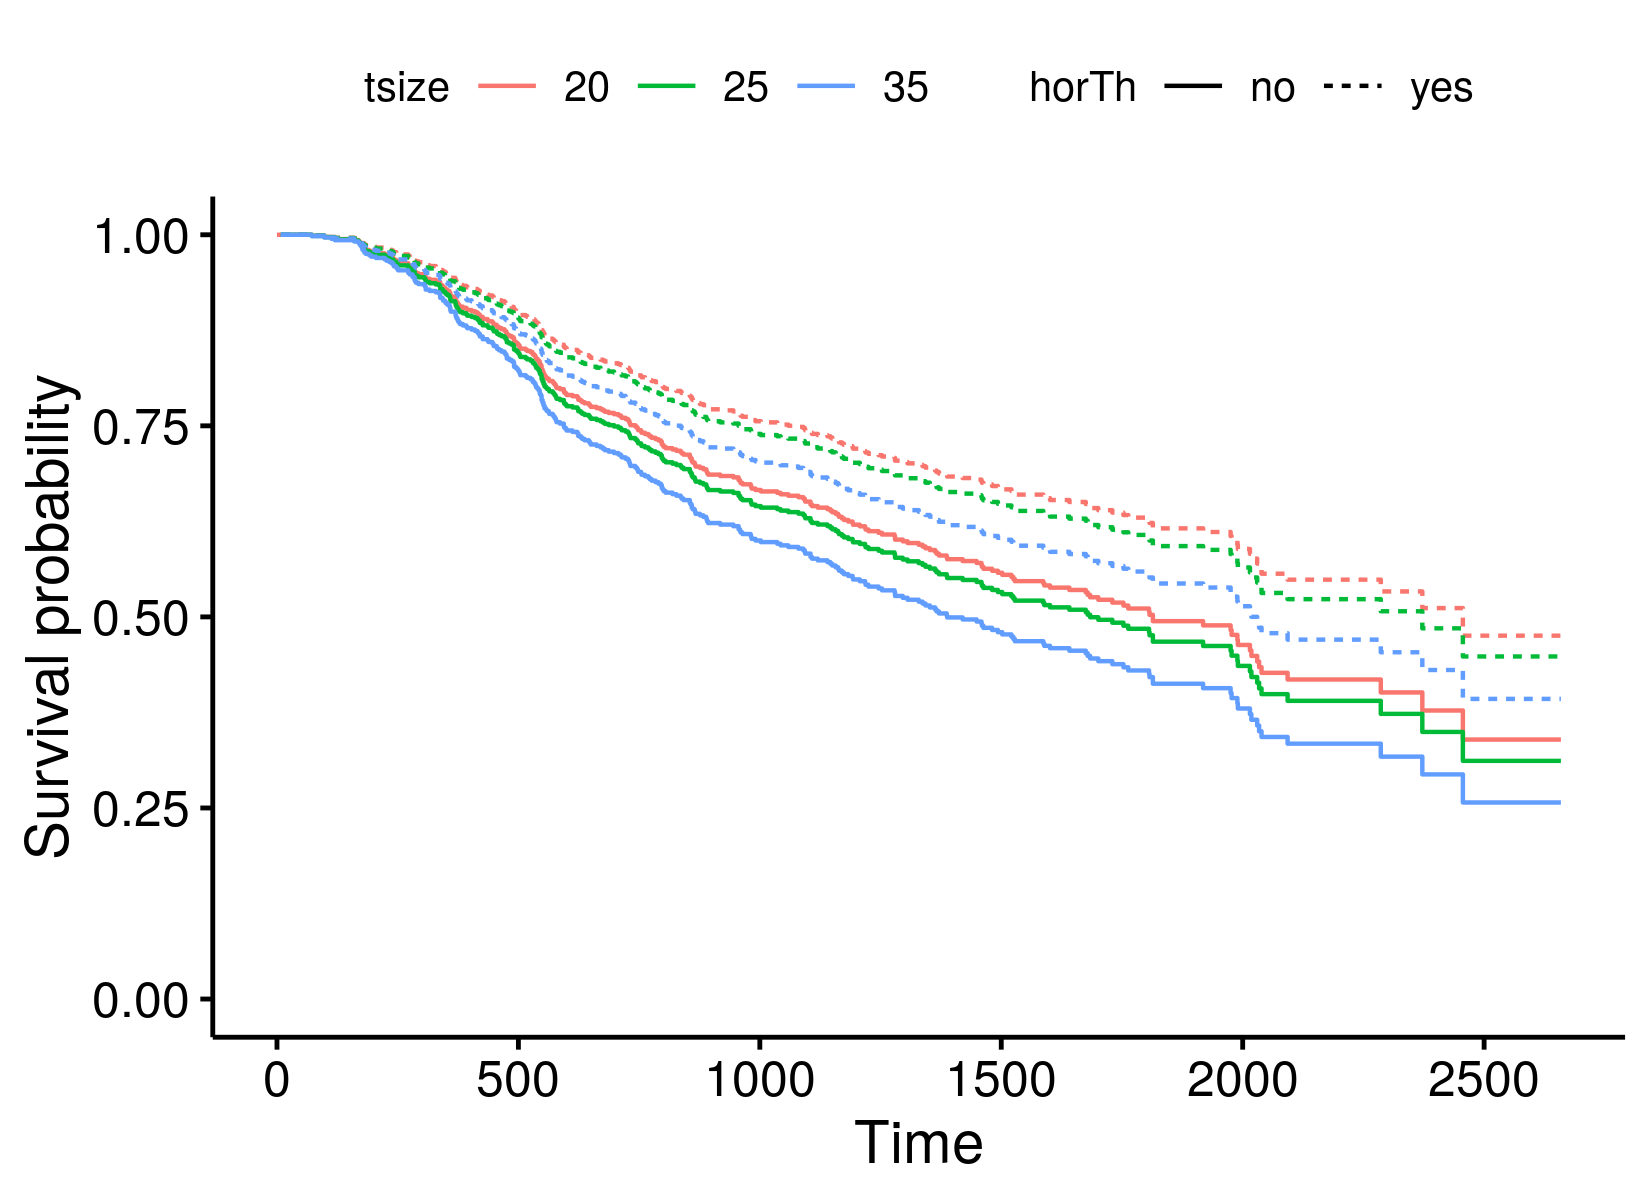
स्टेप 4: प्लॉट करें

ggsurvplot_df(surv_cxmod, linetype = "horTh", color = "tsize",
  legend.title = NULL, censor = FALSE)
R में Survival Analysis

अब आपकी बारी है विज़ुअलाइज़ करने की!

R में Survival Analysis

Preparing Video For Download...