seaborn के साथ श्रेणीवार सार-सांख्यिकी

Python में वित्तीय डेटा इम्पोर्ट और मैनेज करना

Stefan Jansen

Instructor

seaborn में categorical plots

  • श्रेणीगत और संख्यात्मक वैरिएबल के संयोजन प्लॉट करने के खास तरीके
  • हर श्रेणी के लिए summary statistics के अनुमानों को visualize करें
  • समझें कि श्रेणियाँ संख्यात्मक वैरिएबल पर कैसे असर डालती हैं
  • वितरण की प्रमुख metrics से तुलना करें
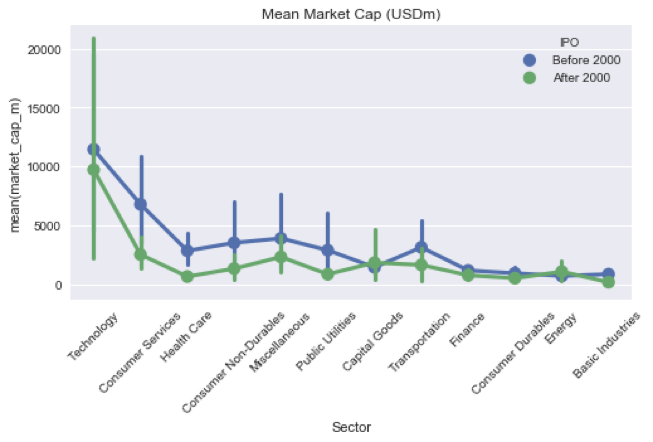
  • उदाहरण: हर Sector या IPO Year के लिए Mean Market Cap, dispersion के संकेत सहित
Python में वित्तीय डेटा इम्पोर्ट और मैनेज करना

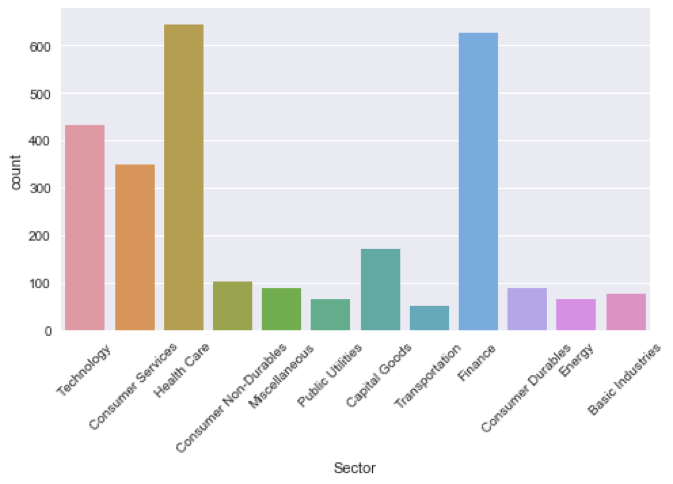
बेसिक्स: countplot

sns.countplot(x='Sector', data=nasdaq)
plt.xticks(rotation=45)
countplot.png

Python में वित्तीय डेटा इम्पोर्ट और मैनेज करना

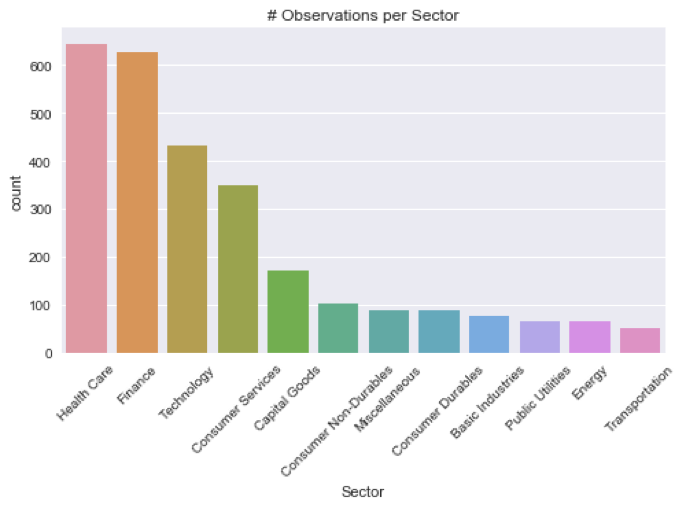
countplot, sorted

sector_size = nasdaq.groupby('Sector').size()
order = sector_size.sort_values(ascending=False)
order.head()
Sector
Health Care          645
Finance              627
Technology           433
...
order = order.index.tolist()
['Health Care', 'Finance', ..., 'Energy', 'Transportation']
Python में वित्तीय डेटा इम्पोर्ट और मैनेज करना

countplot, sorted

sns.countplot(x='Sector', data=nasdaq, order=order)
plt.xticks(rotation=45)
plt.title('# Observations per Sector')
countplot_sorted.png

Python में वित्तीय डेटा इम्पोर्ट और मैनेज करना

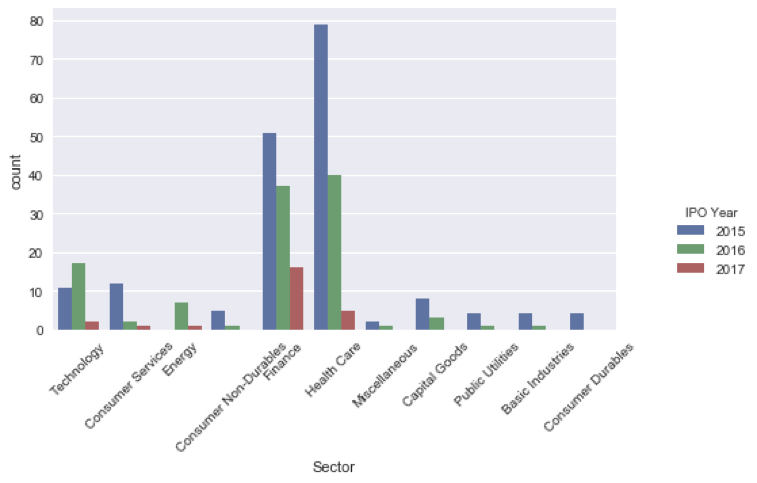
countplot, multiple categories

recent_ipos = nasdaq[nasdaq['IPO Year'] > 2014]
recent_ipos['IPO Year'] = recent_ipos['IPO Year'].astype(int)
sns.countplot(x='Sector', hue='IPO Year', data=recent_ipos)
countplot_mc.png

Python में वित्तीय डेटा इम्पोर्ट और मैनेज करना

PointPlot से stats की तुलना करें

nasdaq['IPO'] = nasdaq['IPO Year'].apply(lambda x: 'After 2000' if x > 2000 else 'Before 2000')
sns.pointplot(x='Sector', y='market_cap_m', hue='IPO', data=nasdaq)
plt.xticks(rotation=45); plt.title('Mean Market Cap')
pointplot.png

Python में वित्तीय डेटा इम्पोर्ट और मैनेज करना

अभ्यास करते हैं!

Python में वित्तीय डेटा इम्पोर्ट और मैनेज करना

Preparing Video For Download...