कई टाइम सीरीज़ के बीच संबंध ढूँढें

Python में Time Series Data का विज़ुअलाइज़ेशन

Thomas Vincent

Head of Data Science, Getty Images

दो वैरिएबल्स के बीच correlations

  • सांख्यिकी में, correlation coefficient दो वैरिएबल्स के बीच संबंध की ताकत या उसकी कमी मापने के लिए उपयोग होता है:
    • रैखिक संबंध मानते हों तो Pearson's coefficient से correlation coefficient निकालें
    • गैर-रैखिक संबंध मानते हों तो Kendall Tau या Spearman rank से correlation coefficient निकालें
Python में Time Series Data का विज़ुअलाइज़ेशन

Correlations की गणना करें

from scipy.stats.stats import pearsonr
from scipy.stats.stats import spearmanr
from scipy.stats.stats import kendalltau
x = [1, 2, 4, 7]
y = [1, 3, 4, 8]
pearsonr(x, y)
SpearmanrResult(correlation=0.9843, pvalue=0.01569)
spearmanr(x, y)
SpearmanrResult(correlation=1.0, pvalue=0.0)
kendalltau(x, y)
KendalltauResult(correlation=1.0, pvalue=0.0415)
Python में Time Series Data का विज़ुअलाइज़ेशन

Correlation matrix क्या है?

  • दो से अधिक वैरिएबल्स के बीच correlation coefficient निकालते समय आपको एक correlation matrix मिलता है
    • रेंज: [-1, 1]
    • 0: कोई संबंध नहीं
    • 1: मज़बूत सकारात्मक संबंध
    • -1: मज़बूत नकारात्मक संबंध
Python में Time Series Data का विज़ुअलाइज़ेशन

Correlation matrix क्या है?

  • एक correlation matrix हमेशा "symmetric" होती है
  • diagonal मान हमेशा 1 के बराबर होते हैं
   x     y     z
x  1.00 -0.46  0.49
y -0.46  1.00 -0.61
z  0.49 -0.61  1.00
Python में Time Series Data का विज़ुअलाइज़ेशन

Pandas के साथ correlation matrices निकालना

corr_p = meat[['beef', 'veal','turkey']].corr(method='pearson')
print(corr_p)
          beef     veal     turkey
beef      1.000   -0.829    0.738
veal     -0.829    1.000   -0.768
turkey    0.738   -0.768    1.000
corr_s = meat[['beef', 'veal','turkey']].corr(method='spearman')
print(corr_s)
          beef     veal     turkey
beef      1.000   -0.812    0.778
veal     -0.812    1.000   -0.829
turkey    0.778   -0.829    1.000
Python में Time Series Data का विज़ुअलाइज़ेशन

Pandas के साथ correlation matrices निकालना

corr_mat = meat.corr(method='pearson')
Python में Time Series Data का विज़ुअलाइज़ेशन

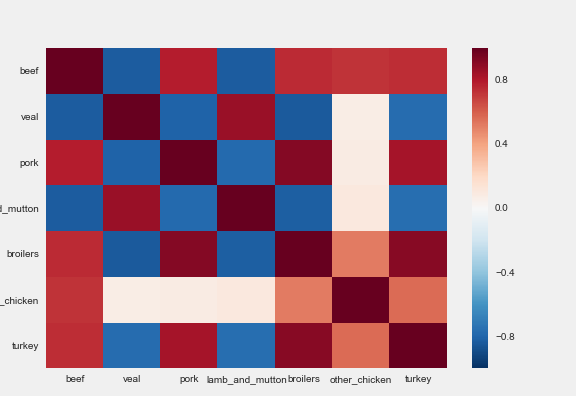
Heatmap

import seaborn as sns

sns.heatmap(corr_mat)
Python में Time Series Data का विज़ुअलाइज़ेशन

Heatmap

correlation matrix का एक heatmap

Python में Time Series Data का विज़ुअलाइज़ेशन

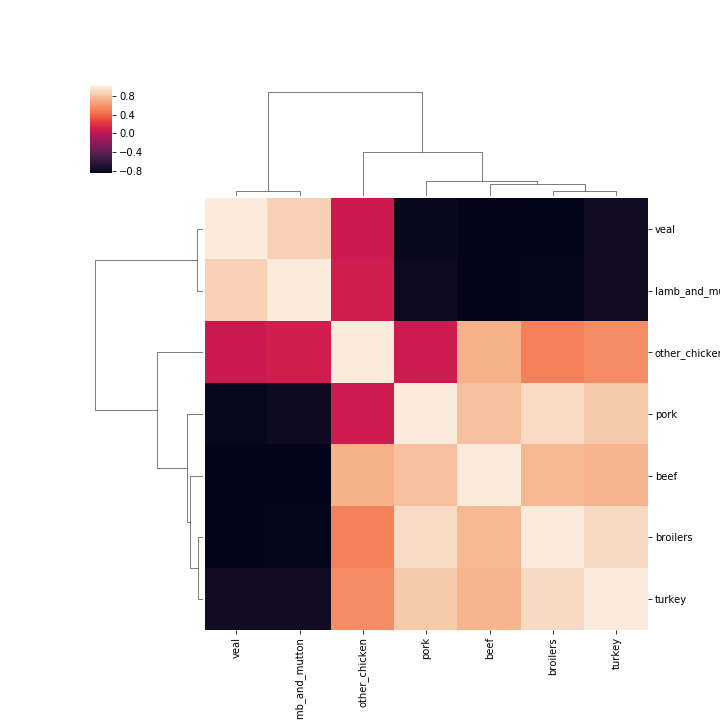
Clustermap

sns.clustermap(corr_mat)
Python में Time Series Data का विज़ुअलाइज़ेशन

correlation matrix का एक clustermap

Python में Time Series Data का विज़ुअलाइज़ेशन

अभ्यास करते हैं!

Python में Time Series Data का विज़ुअलाइज़ेशन

Preparing Video For Download...