टाइम सीरीज़ के बीच सहसंबंध निकालें

Python में Time Series Data का विज़ुअलाइज़ेशन

Thomas Vincent

Head of Data Science, Getty Images

जॉब्स डेटा में ट्रेंड्स

print(trend_df)
datestamp  Agriculture  Business services  Construction

2000-01-01          NaN                NaN           NaN   
2000-02-01          NaN                NaN           NaN   
2000-03-01          NaN                NaN           NaN   
2000-04-01          NaN                NaN           NaN   
2000-05-01          NaN                NaN           NaN   
2000-06-01          NaN                NaN           NaN   
2000-07-01     9.170833           4.787500      6.329167   
2000-08-01     9.466667           4.820833      6.304167   
...
Python में Time Series Data का विज़ुअलाइज़ेशन

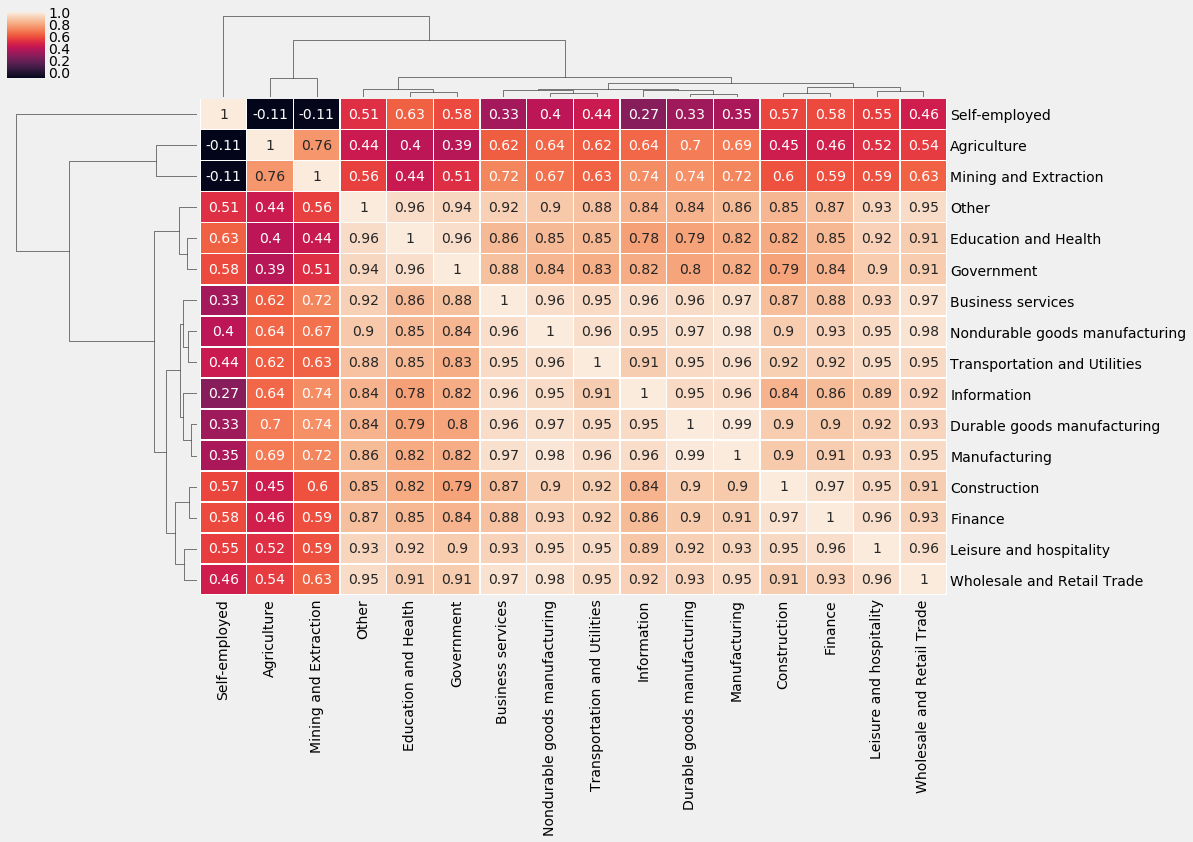
जॉब्स कोरिलेशन मैट्रिक्स का क्लस्टरमैप प्लॉट करना

# Get correlation matrix of the seasonality_df DataFrame
trend_corr = trend_df.corr(method='spearman')

# Customize the clustermap of the seasonality_corr
correlation matrix
fig = sns.clustermap(trend_corr, annot=True, linewidth=0.4)

plt.setp(fig.ax_heatmap.yaxis.get_majorticklabels(),
rotation=0)

plt.setp(fig.ax_heatmap.xaxis.get_majorticklabels(),
rotation=90)
Python में Time Series Data का विज़ुअलाइज़ेशन

जॉब्स कोरिलेशन मैट्रिक्स

जॉब्स कोरिलेशन मैट्रिक्स

Python में Time Series Data का विज़ुअलाइज़ेशन

अभ्यास करते हैं!

Python में Time Series Data का विज़ुअलाइज़ेशन

Preparing Video For Download...