अपने डेटा के एग्रीगेट्स प्लॉट करें

Python में Time Series Data का विज़ुअलाइज़ेशन

Thomas Vincent

Head of Data Science, Getty Images

मूविंग एवरेज

  • टाइम सीरीज़ विश्लेषण में, मूविंग एवरेज कई काम आता है:
    • अल्पकालिक उतार-चढ़ाव को स्मूद करना
    • आउटलायर हटाना
    • दीर्घकालिक ट्रेंड या साइकल्स को उभारना.
Python में Time Series Data का विज़ुअलाइज़ेशन

मूविंग एवरेज मॉडल

co2_levels_mean = co2_levels.rolling(window=52).mean()

ax = co2_levels_mean.plot()
ax.set_xlabel("Date")
ax.set_ylabel("The values of my Y axis")
ax.set_title("52 weeks rolling mean of my time series")

plt.show()
Python में Time Series Data का विज़ुअलाइज़ेशन

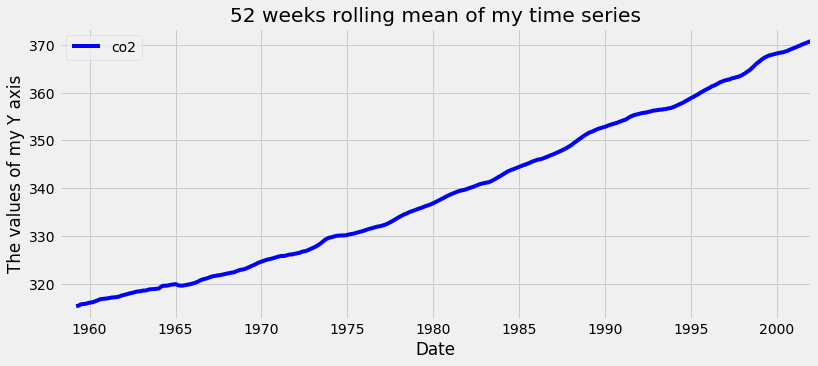
CO2 डेटा के लिए मूविंग एवरेज का प्लॉट

टाइम सीरीज़ का रोलिंग मीन

Python में Time Series Data का विज़ुअलाइज़ेशन

टाइम सीरीज़ के एग्रीगेट वैल्यूज़ निकालना

co2_levels.index
DatetimeIndex(['1958-03-29', '1958-04-05',...],
              dtype='datetime64[ns]', name='datestamp', 
              length=2284, freq=None)
print(co2_levels.index.month)
array([ 3,  4,  4, ..., 12, 12, 12], dtype=int32)
print(co2_levels.index.year)
array([1958, 1958, 1958, ..., 2001,
      2001, 2001], dtype=int32)
Python में Time Series Data का विज़ुअलाइज़ेशन

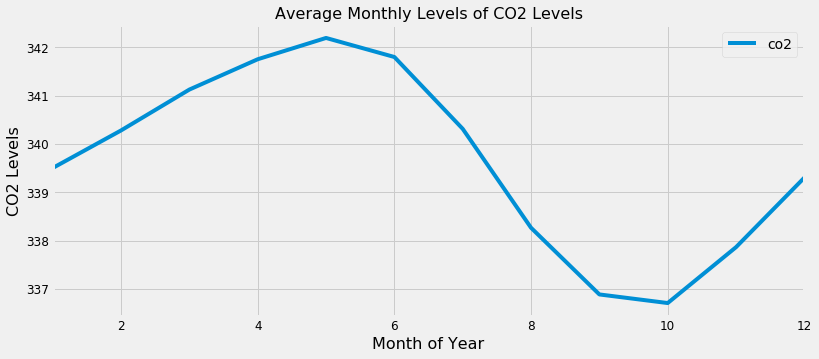
टाइम सीरीज़ के एग्रीगेट वैल्यूज़ प्लॉट करना
index_month = co2_levels.index.month
co2_levels_by_month = co2_levels.groupby(index_month).mean()
co2_levels_by_month.plot()

plt.show()
Python में Time Series Data का विज़ुअलाइज़ेशन

टाइम सीरीज़ के एग्रीगेट वैल्यूज़ प्लॉट करना

CO2 लेवल्स डेटा के मंथली एग्रीगेट्स

Python में Time Series Data का विज़ुअलाइज़ेशन

अभ्यास करते हैं!

Python में Time Series Data का विज़ुअलाइज़ेशन

Preparing Video For Download...