Python में Time Series Data का विज़ुअलाइज़ेशन
Thomas Vincent
Head of Data Science, Getty Images
plt उपनाम से इम्पोर्ट किया जाता हैimport matplotlib.pyplot as plt

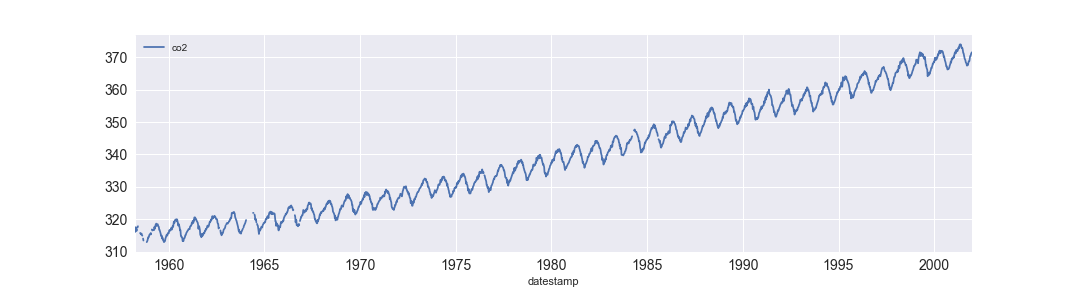
import matplotlib.pyplot as plt
import pandas as pd
df = df.set_index('date_column')
df.plot()
plt.show()
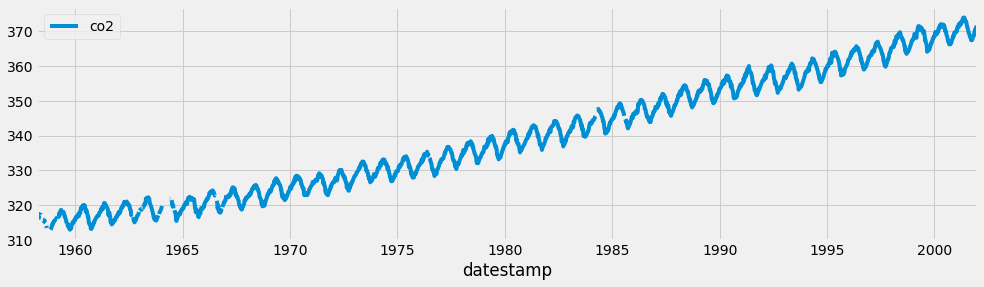
plt.style.use('fivethirtyeight')
df.plot()
plt.show()

print(plt.style.available)
['seaborn-dark-palette', 'seaborn-darkgrid',
'seaborn-dark', 'seaborn-notebook',
'seaborn-pastel', 'seaborn-white',
'classic', 'ggplot', 'grayscale',
'dark_background', 'seaborn-poster',
'seaborn-muted', 'seaborn', 'bmh',
'seaborn-paper', 'seaborn-whitegrid',
'seaborn-bright', 'seaborn-talk',
'fivethirtyeight', 'seaborn-colorblind',
'seaborn-deep', 'seaborn-ticks']
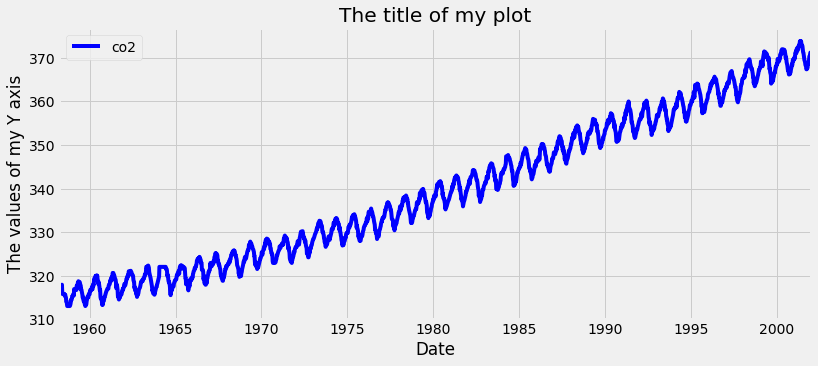
ax = df.plot(color='blue')
ax.set_xlabel('Date')
ax.set_ylabel('The values of my Y axis')
ax.set_title('The title of my plot')
plt.show()

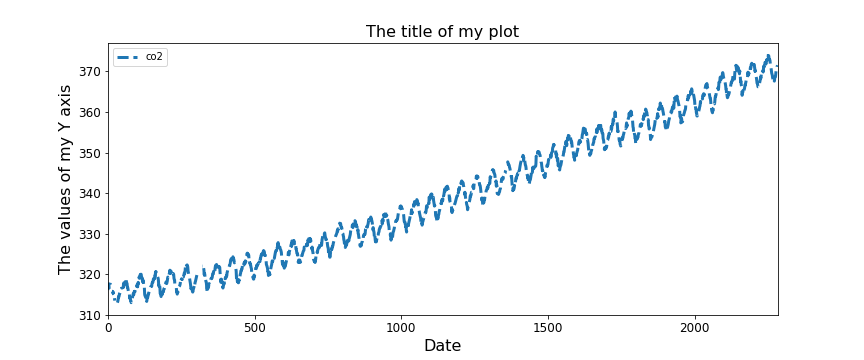
ax = df.plot(figsize=(12, 5), fontsize=12,
linewidth=3, linestyle='--')
ax.set_xlabel('Date', fontsize=16)
ax.set_ylabel('The values of my Y axis', fontsize=16)
ax.set_title('The title of my plot', fontsize=16)
plt.show()

Python में Time Series Data का विज़ुअलाइज़ेशन