Python में Time Series Data का विज़ुअलाइज़ेशन
Thomas Vincent
Head of Data Science, Getty Images
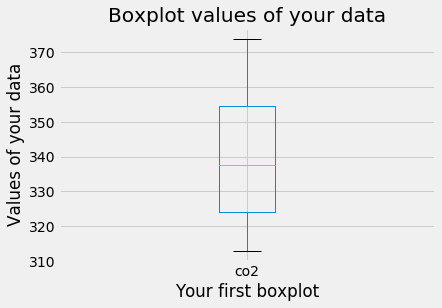
.describe() मेथड आपके DataFrame की सभी संख्यात्मक कॉलमों के मुख्य आँकड़े अपने-आप निकालता है
print(df.describe())
co2
count 2284.000000
mean 339.657750
std 17.100899
min 313.000000
25% 323.975000
50% 337.700000
75% 354.500000
max 373.900000
ax1 = df.boxplot()
ax1.set_xlabel('आपका पहला बॉक्सप्लॉट')
ax1.set_ylabel('आपके डेटा के मान')
ax1.set_title('आपके डेटा के बॉक्सप्लॉट मान')
plt.show()

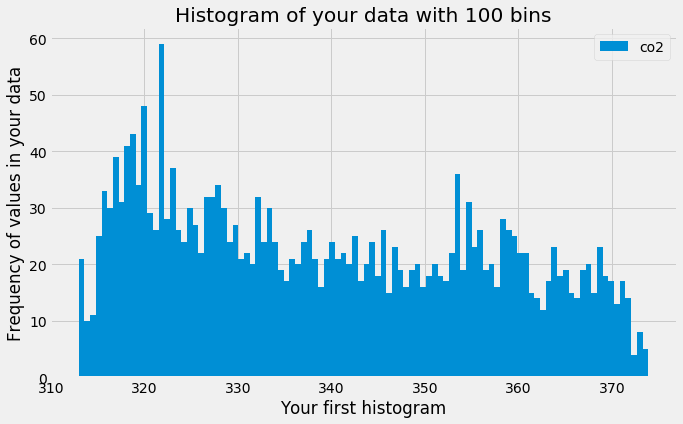
ax2 = df.plot(kind='hist', bins=100)
ax2.set_xlabel('आपका पहला हिस्टोग्राम')
ax2.set_ylabel('आपके डेटा में मानों की आवृत्ति')
ax2.set_title('100 बिन वाला आपके डेटा का हिस्टोग्राम')
plt.show()

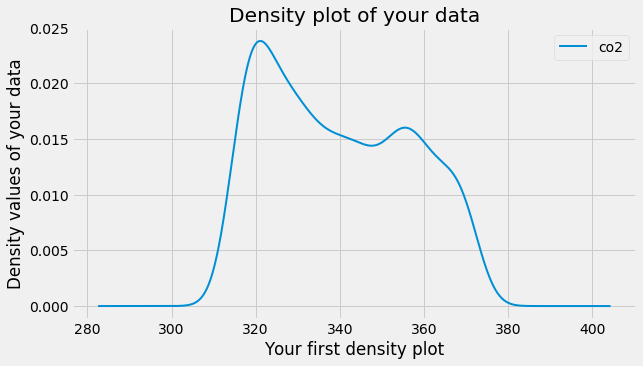
ax3 = df.plot(kind='density', linewidth=2)
ax3.set_xlabel('आपका पहला डेंसिटी प्लॉट')
ax3.set_ylabel('आपके डेटा के डेंसिटी मान')
ax3.set_title('आपके डेटा का डेंसिटी प्लॉट')
plt.show()

Python में Time Series Data का विज़ुअलाइज़ेशन