एकाधिक टाइम सीरीज़ प्लॉट करें

Python में Time Series Data का विज़ुअलाइज़ेशन

Thomas Vincent

Head of Data Science, Getty Images

स्पष्टता सबसे ज़रूरी है

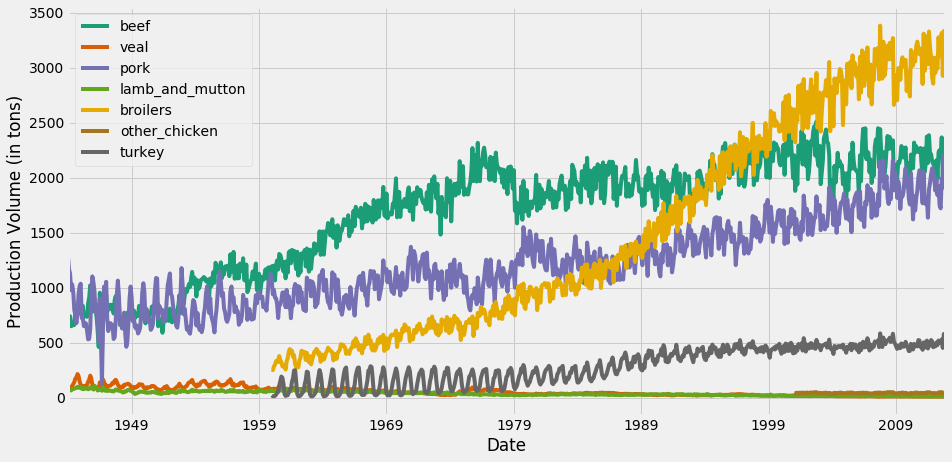
इस प्लॉट में, डिफॉल्ट matplotlib कलर स्कीम beef और turkey टाइम सीरीज़ को एक ही रंग देती है.
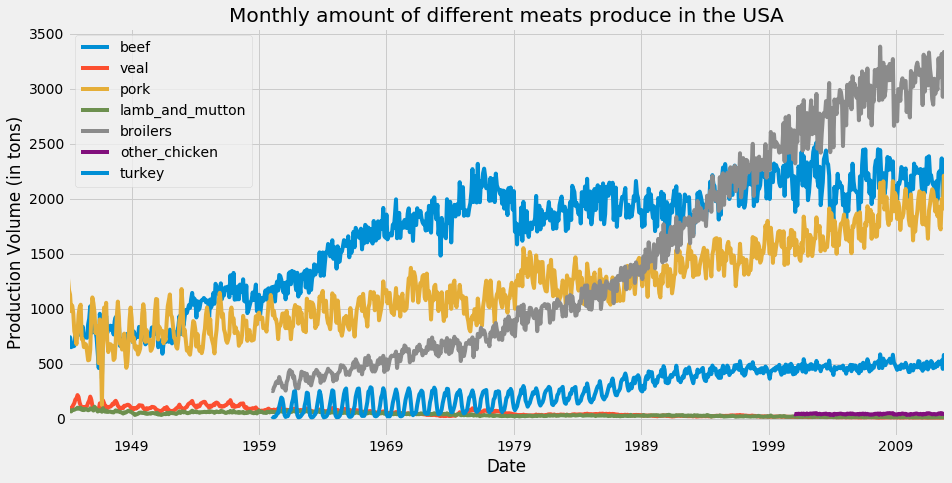
matplotlib में रंग चक्र

Python में Time Series Data का विज़ुअलाइज़ेशन

colormap आर्ग्यूमेंट

ax = df.plot(colormap='Dark2', figsize=(14, 7))
ax.set_xlabel('Date')
ax.set_ylabel('Production Volume (in tons)')

plt.show()

उपलब्ध सभी colormaps की सूची के लिए, यहाँ क्लिक करें.

Python में Time Series Data का विज़ुअलाइज़ेशन

colormap से लाइन रंग बदलें

टाइम सीरीज़ विज़ुअलाइज़ेशन के लिए रंग स्कीम बदलना

Python में Time Series Data का विज़ुअलाइज़ेशन

प्लॉट में उपयोगी जानकारी जोड़ें

ax = df.plot(colormap='Dark2', figsize=(14, 7))

df_summary = df.describe() # Specify values of cells in the table ax.table(cellText=df_summary.values, # Specify width of the table colWidths=[0.3]*len(df.columns), # Specify row labels rowLabels=df_summary.index, # Specify column labels colLabels=df_summary.columns, # Specify location of the table loc='top') plt.show()
Python में Time Series Data का विज़ुअलाइज़ेशन

अपने प्लॉट्स में सांख्यिकीय सारांश जोड़ना
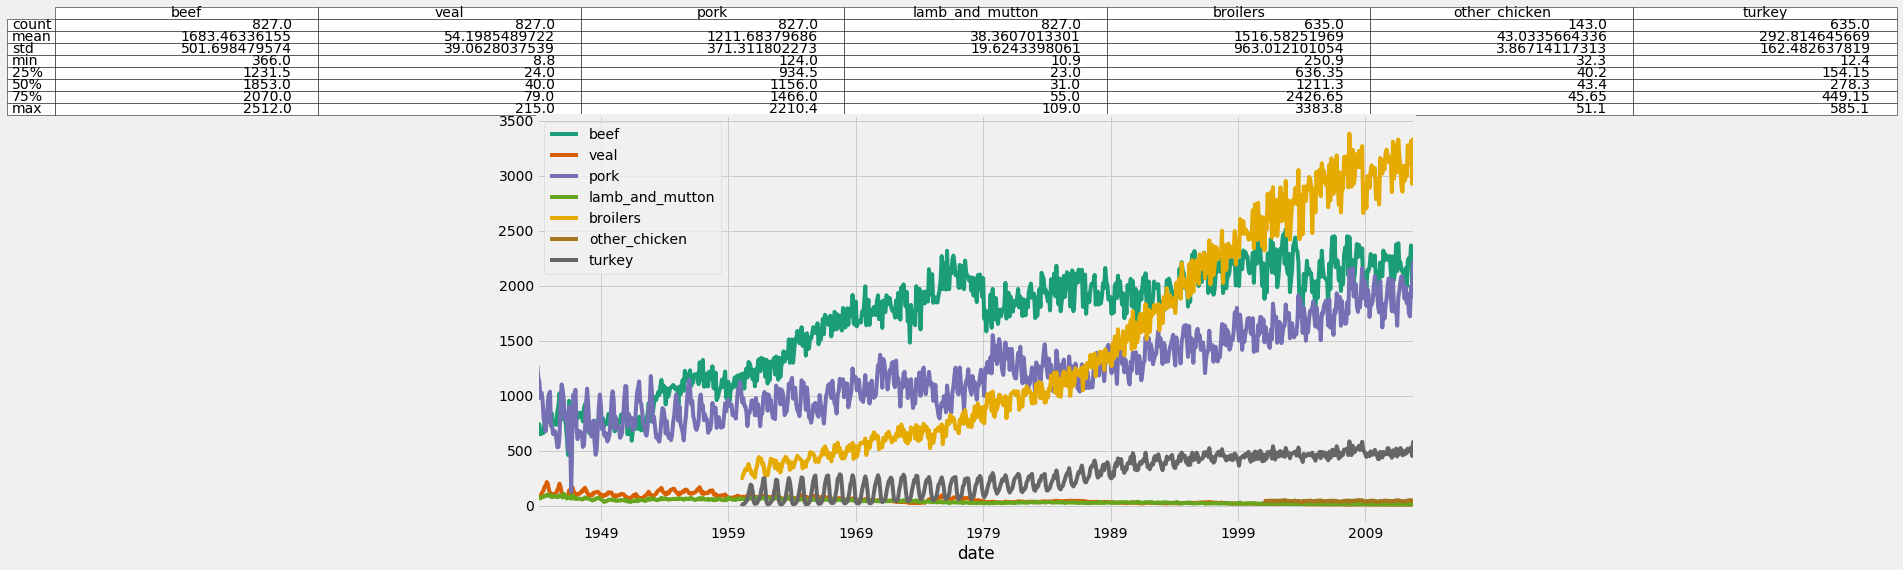
अपने प्लॉट्स में सांख्यिकीय सारांश जोड़ना

Python में Time Series Data का विज़ुअलाइज़ेशन

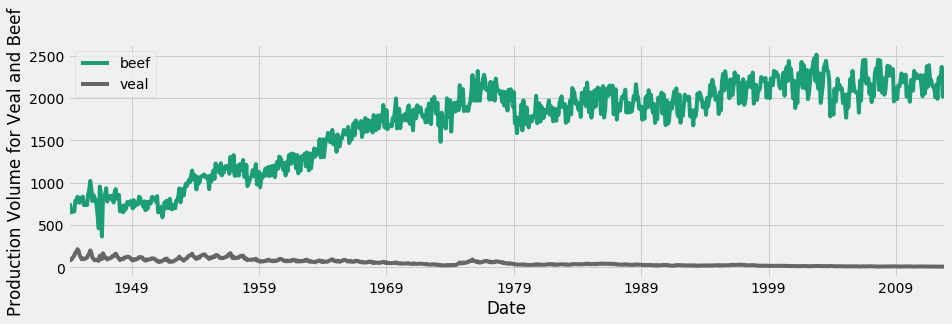
अलग-अलग स्केल से निपटना

beef और veal के टाइम सीरीज़

Python में Time Series Data का विज़ुअलाइज़ेशन

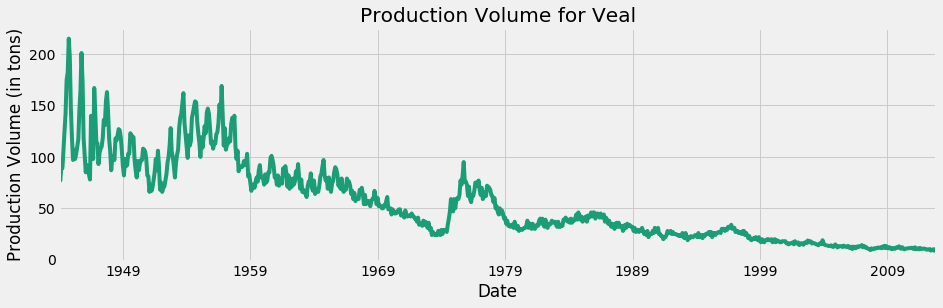
सिर्फ veal

सिर्फ veal का टाइम सीरीज़

Python में Time Series Data का विज़ुअलाइज़ेशन

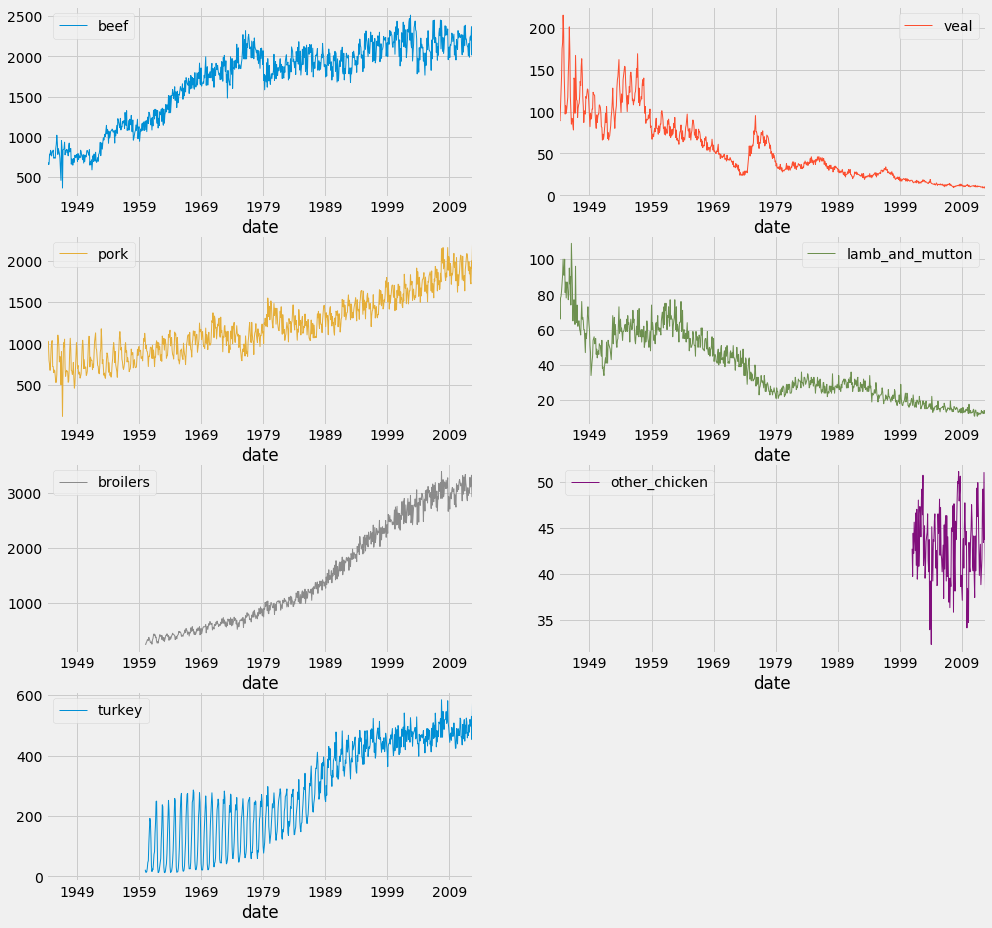
फैसेट प्लॉट्स

df.plot(subplots=True,
                linewidth=0.5,
                layout=(2, 4),
                figsize=(16, 10),
                sharex=False,
                sharey=False)

plt.show()
Python में Time Series Data का विज़ुअलाइज़ेशन

फैसेट प्लॉट्स

Python में Time Series Data का विज़ुअलाइज़ेशन

अब बारी है अभ्यास की!

Python में Time Series Data का विज़ुअलाइज़ेशन

Preparing Video For Download...