Python में Time Series Data का विज़ुअलाइज़ेशन
Thomas Vincent
Head of Data Science, Getty Images
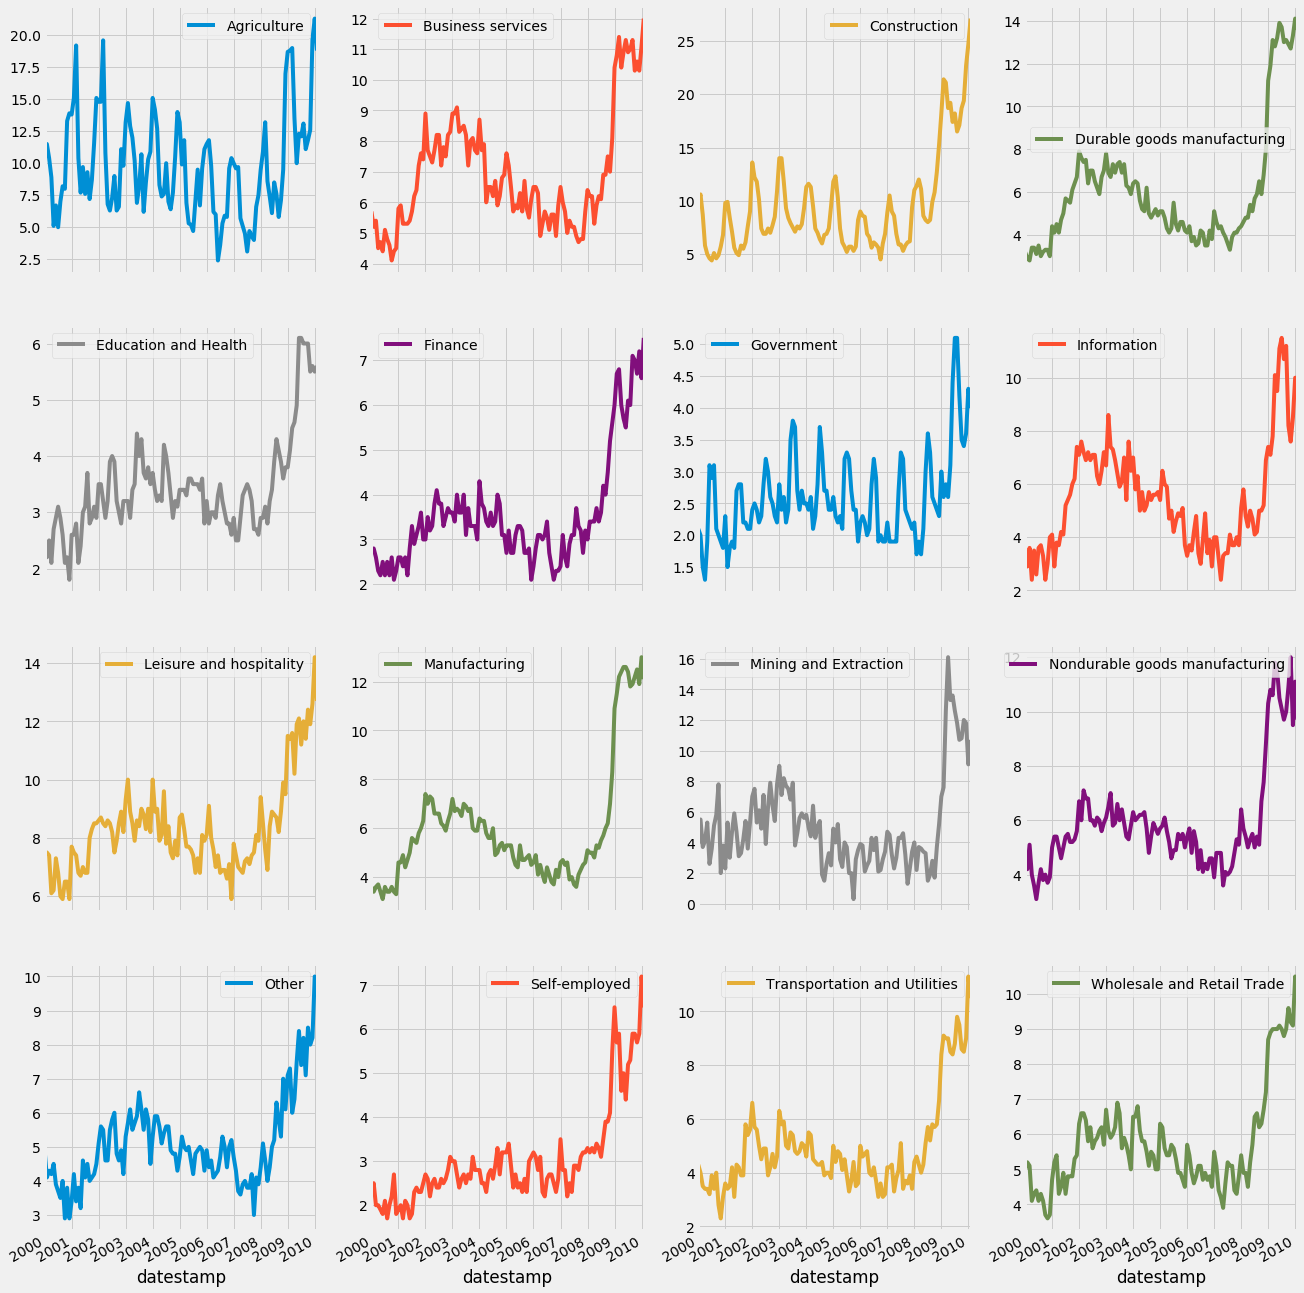
jobs.plot(subplots=True,
            layout=(4, 4),
            figsize=(20, 16),
            sharex=True,
            sharey=False)

plt.show()
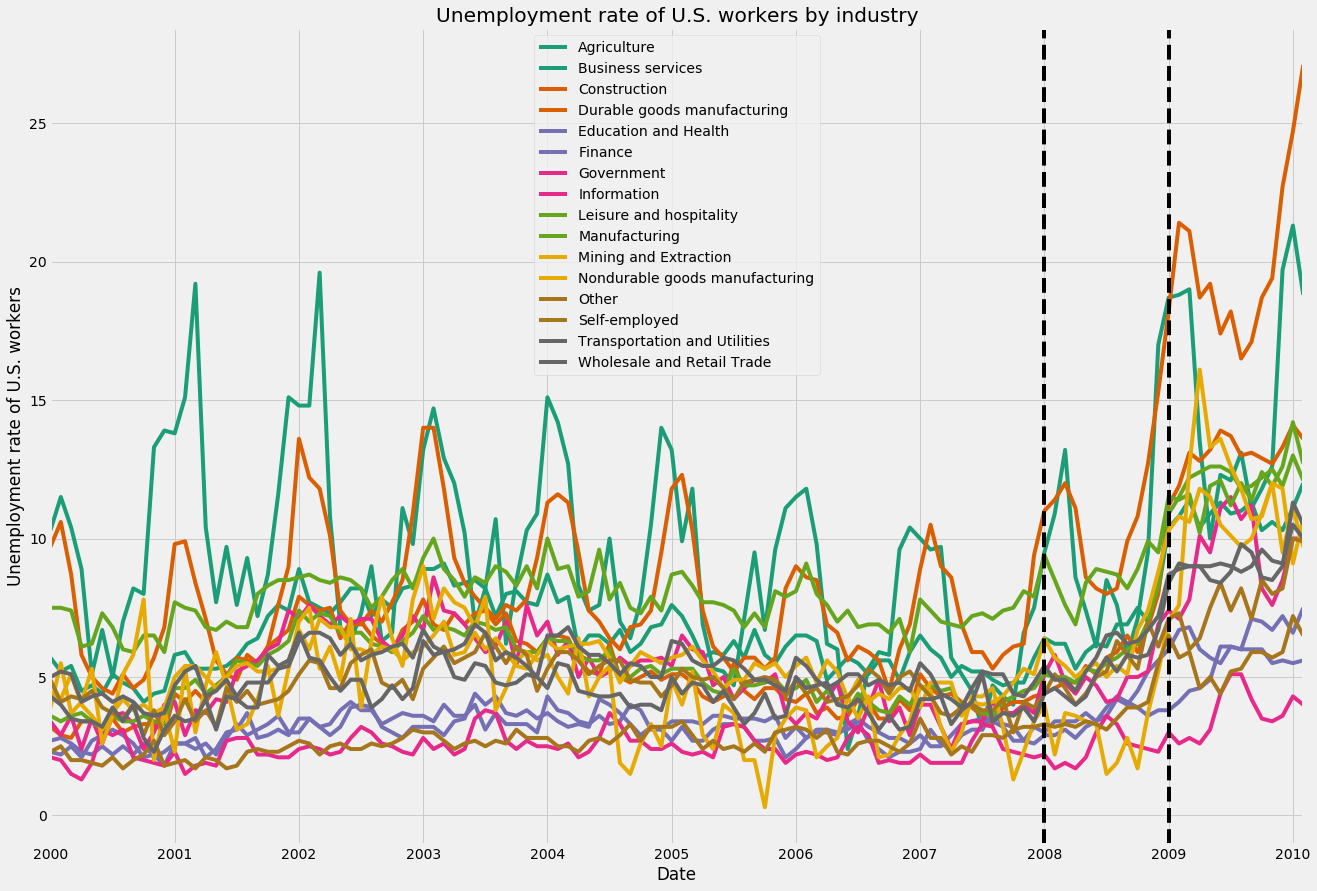
ax = jobs.plot(figsize=(20, 14), colormap='Dark2')

ax.axvline('2008-01-01', color='black',
            linestyle='--')
ax.axvline('2009-01-01', color='black',
            linestyle='--')
ax = jobs.plot(figsize=(20, 14), colormap='Dark2')
ax.axvline('2008-01-01', color='black', linestyle='--') ax.axvline('2009-01-01', color='black', linestyle='--')
print(jobs.index)
DatetimeIndex(['2000-01-01', '2000-02-01', '2000-03-01',
'2000-04-01', '2009-09-01','2009-10-01',
'2009-11-01', '2009-12-01','2010-01-01', '2010-02-01'],
dtype='datetime64[ns]', name='datestamp',
length=122, freq=None)
index_month = jobs.index.month
jobs_by_month = jobs.groupby(index_month).mean()
print(jobs_by_month)
datestamp    Agriculture  Business services  Construction
1            13.763636           7.863636     12.909091
2            13.645455           7.645455     13.600000
3            13.830000           7.130000     11.290000
4             9.130000           6.270000      9.450000
5             7.100000           6.600000      8.120000
...
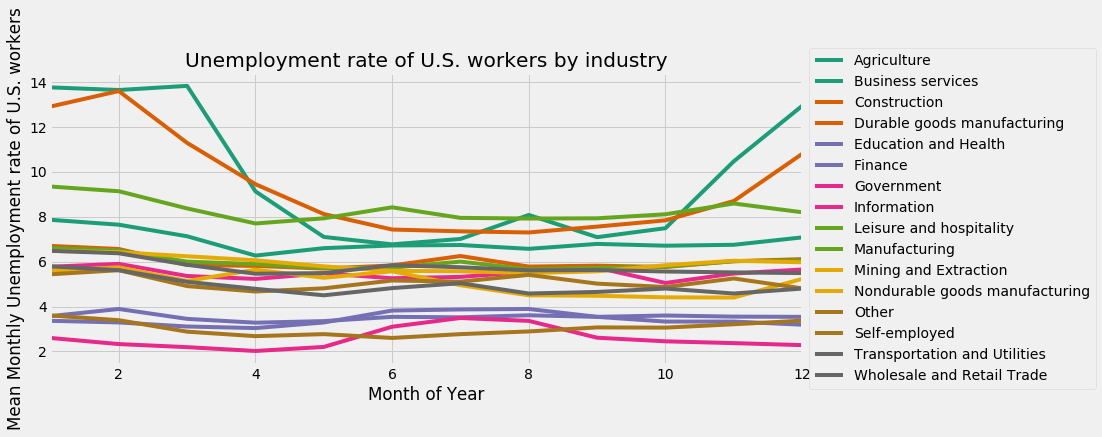
ax = jobs_by_month.plot(figsize=(12, 5),
colormap='Dark2')
ax.legend(bbox_to_anchor=(1.0, 0.5),
loc='center left')