अपनी time series प्लॉट को कस्टमाइज़ करें

Python में Time Series Data का विज़ुअलाइज़ेशन

Thomas Vincent

Head of Data Science, Getty Images

Time series डेटा को slice करना

discoveries['1960':'1970']
discoveries['1950-01':'1950-12']
discoveries['1960-01-01':'1960-01-15']
Python में Time Series Data का विज़ुअलाइज़ेशन

Time series डेटा के subset का प्लॉट बनाना
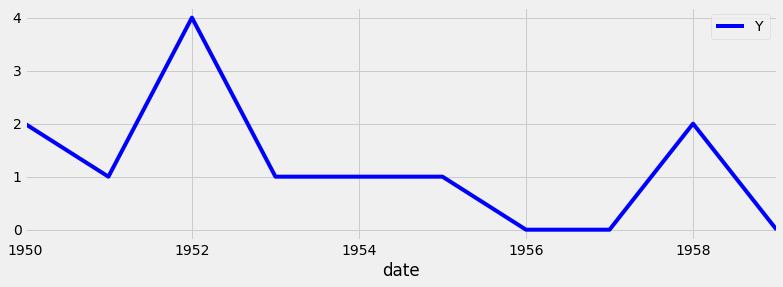
import matplotlib.pyplot as plt
plt.style.use('fivethirtyeight')
df_subset = discoveries['1960':'1970']
ax = df_subset.plot(color='blue', fontsize=14)
plt.show()

Time series subset का उदाहरण

Python में Time Series Data का विज़ुअलाइज़ेशन

Markers जोड़ना

ax.axvline(x='1969-01-01', 
           color='red', 
           linestyle='--')
ax.axhline(y=100, 
           color='green', 
           linestyle='--')
Python में Time Series Data का विज़ुअलाइज़ेशन

Markers का उपयोग: पूरा कोड

ax = discoveries.plot(color='blue')
ax.set_xlabel('Date')
ax.set_ylabel('Number of great discoveries')

ax.axvline('1969-01-01', color='red', linestyle='--') ax.axhline(4, color='green', linestyle='--')
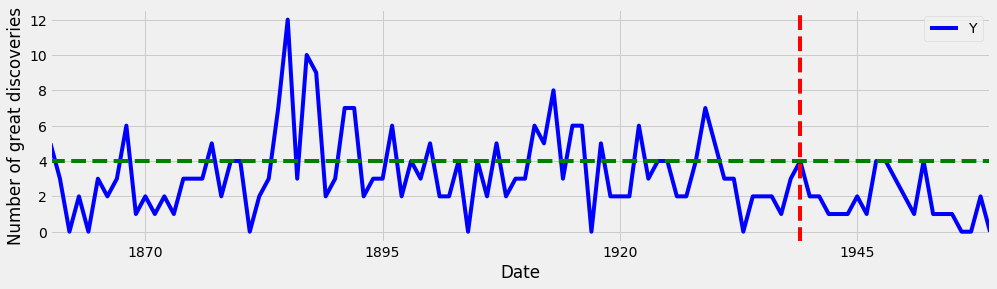
अपने प्लॉट में markers जोड़ना

Python में Time Series Data का विज़ुअलाइज़ेशन

रुचि के क्षेत्रों को हाइलाइट करना

ax.axvspan('1964-01-01', '1968-01-01', 
           color='red', alpha=0.5)
ax.axhspan(8, 6, color='green',
           alpha=0.2)
Python में Time Series Data का विज़ुअलाइज़ेशन

रुचि के क्षेत्रों को हाइलाइट करना: पूरा कोड
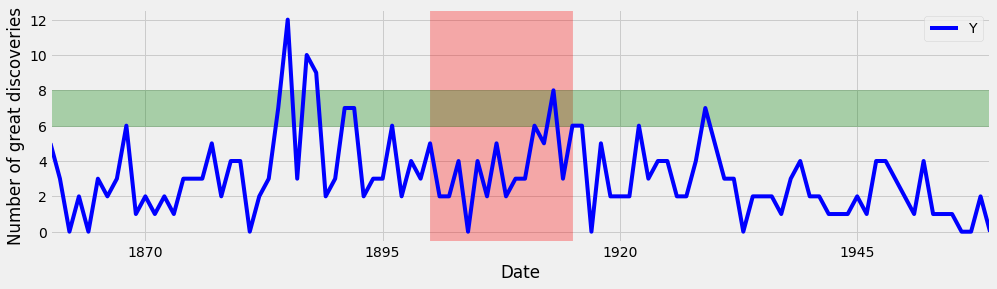
ax = discoveries.plot(color='blue')
ax.set_xlabel('Date')
ax.set_ylabel('Number of great discoveries')
ax.axvspan('1964-01-01', '1968-01-01', color='red',
alpha=0.3)
ax.axhspan(8, 6, color='green', alpha=0.3)

अपने प्लॉट में रुचि के क्षेत्र जोड़ना

Python में Time Series Data का विज़ुअलाइज़ेशन

अभ्यास करते हैं!

Python में Time Series Data का विज़ुअलाइज़ेशन

Preparing Video For Download...