एक से अधिक टाइम सीरीज़ के साथ काम करना

Python में Time Series Data का विज़ुअलाइज़ेशन

Thomas Vincent

Head of Data Science, Getty Images

कई टाइम सीरीज़ के साथ काम करना

एक अलग-थलग टाइम सीरीज़

date ts1
1949-01 112
1949-02 118
1949-03 132

एक फ़ाइल जिसमें कई टाइम सीरीज़ हैं

date ts1 ts2 ts3 ts4 ts5 ts6 ts7
2012-01-01 2113.8 10.4 1987.0 12.1 3091.8 43.2 476.7
2012-02-01 2009.0 9.8 1882.9 12.3 2954.0 38.8 466.8
2012-03-01 2159.8 10.0 1987.9 14.3 3043.7 40.1 502.1
Python में Time Series Data का विज़ुअलाइज़ेशन

Meat production डेटासेट

import pandas as pd
meat = pd.read_csv("meat.csv")
print(meat.head(5))
         date   beef   veal    pork  lamb_and_mutton  broilers   
0  1944-01-01  751.0   85.0  1280.0             89.0       NaN 
1  1944-02-01  713.0   77.0  1169.0             72.0       NaN 
2  1944-03-01  741.0   90.0  1128.0             75.0       NaN 
3  1944-04-01  650.0   89.0   978.0             66.0       NaN 
4  1944-05-01  681.0  106.0  1029.0             78.0       NaN 

   other_chicken  turkey  
0            NaN     NaN  
1            NaN     NaN  
2            NaN     NaN  
3            NaN     NaN  
4            NaN     NaN
Python में Time Series Data का विज़ुअलाइज़ेशन

कई टाइम सीरीज़ का सारांश और प्लॉटिंग

import matplotlib.pyplot as plt
plt.style.use('fivethirtyeight')
ax = df.plot(figsize=(12, 4), fontsize=14)

plt.show()
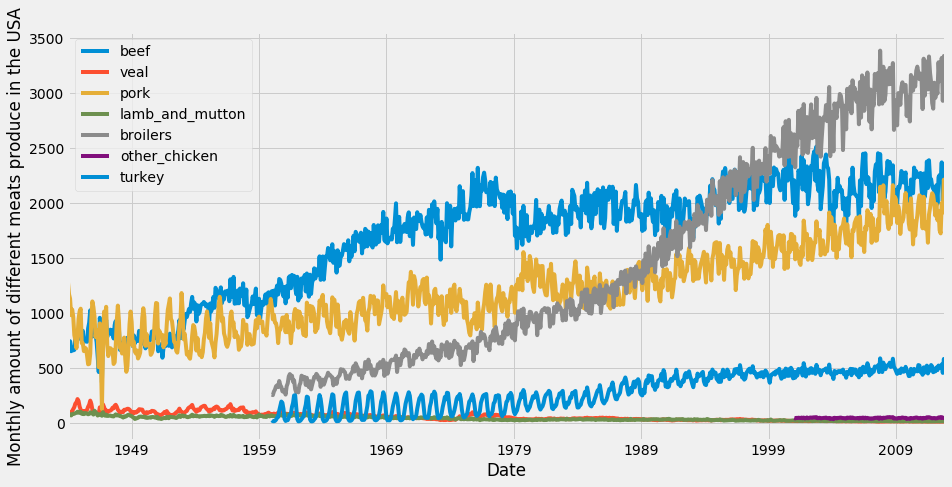
Meat production डेटासेट

Python में Time Series Data का विज़ुअलाइज़ेशन

एरिया चार्ट

import matplotlib.pyplot as plt
plt.style.use('fivethirtyeight')
ax = df.plot.area(figsize=(12, 4), fontsize=14)

plt.show()
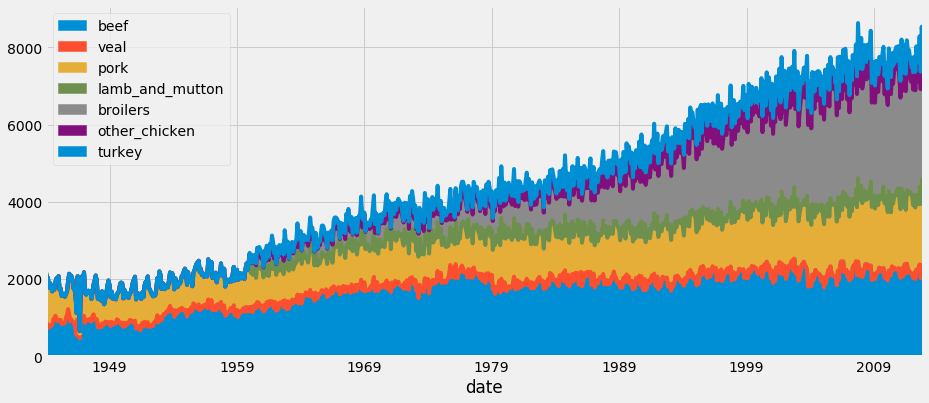
एरिया चार्ट के रूप में Meat production डेटासेट

Python में Time Series Data का विज़ुअलाइज़ेशन

अभ्यास करते हैं!

Python में Time Series Data का विज़ुअलाइज़ेशन

Preparing Video For Download...