Marketing Analytics: Python में Customer Churn की भविष्यवाणी
Mark Peterson
Director of Data Science, Infoblox
seaborn लाइब्रेरी से आप सूचनात्मक और आकर्षक प्लॉट आसानी से बना सकते हैं
matplotlib के ऊपर निर्मित
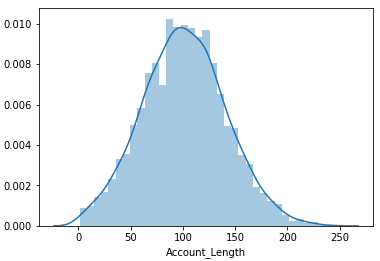
import matplotlib.pyplot as plt import seaborn as snssns.distplot(telco['Account_Length'])plt.show()

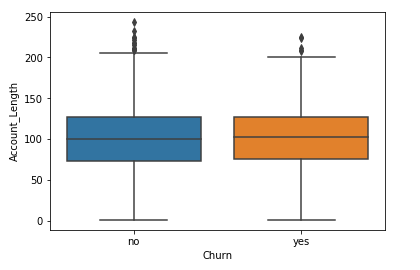
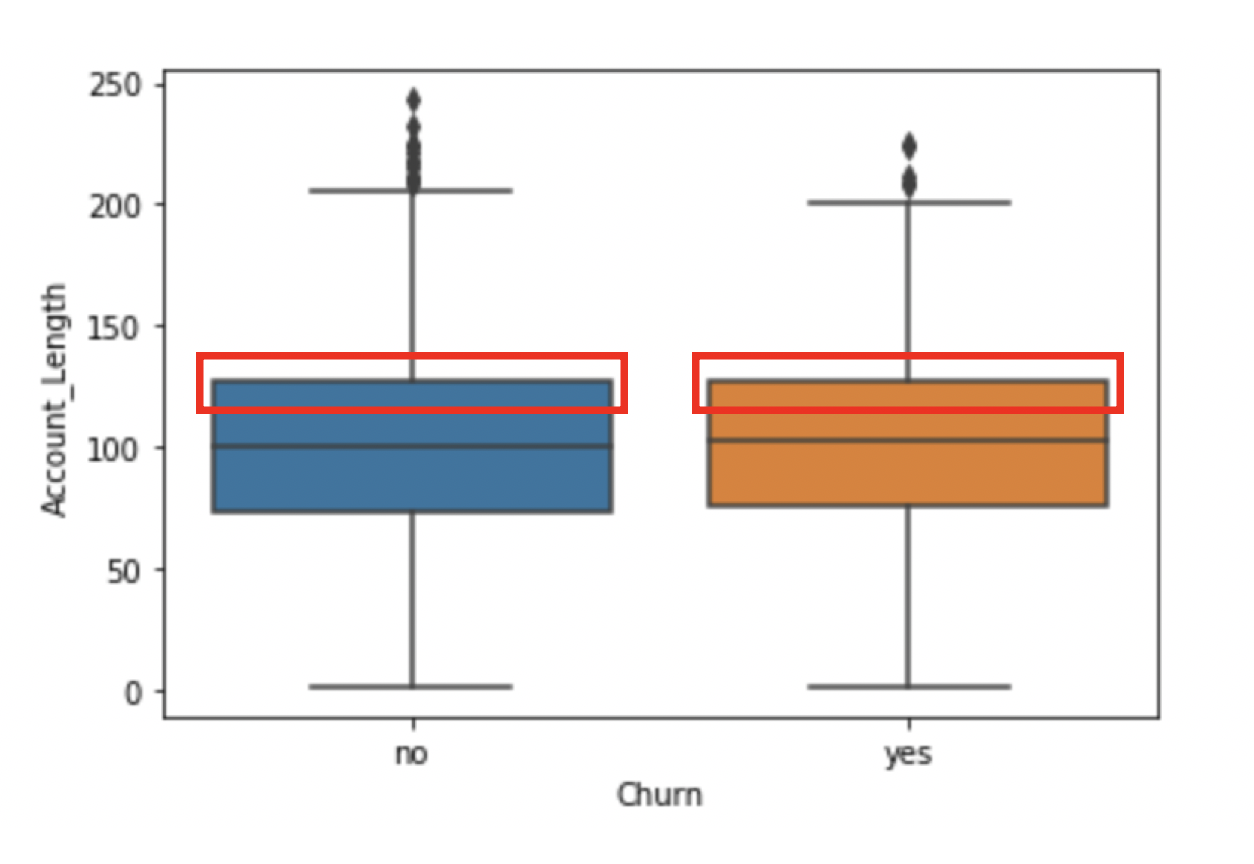
sns.boxplot(x = 'Churn',
y = 'Account_Length',
data = telco)
plt.show()

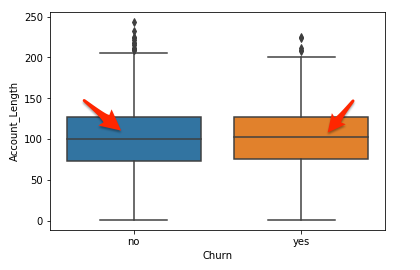
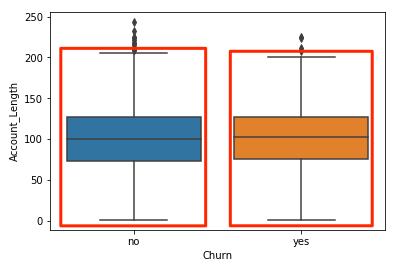
sns.boxplot(x = 'Churn',
y = 'Account_Length',
data = telco)
plt.show()

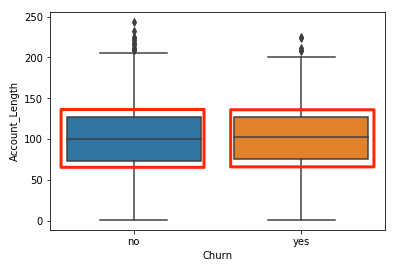
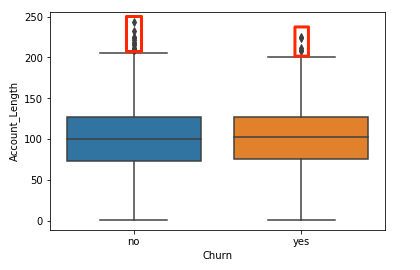
sns.boxplot(x = 'Churn',
y = 'Account_Length',
data = telco)
plt.show()

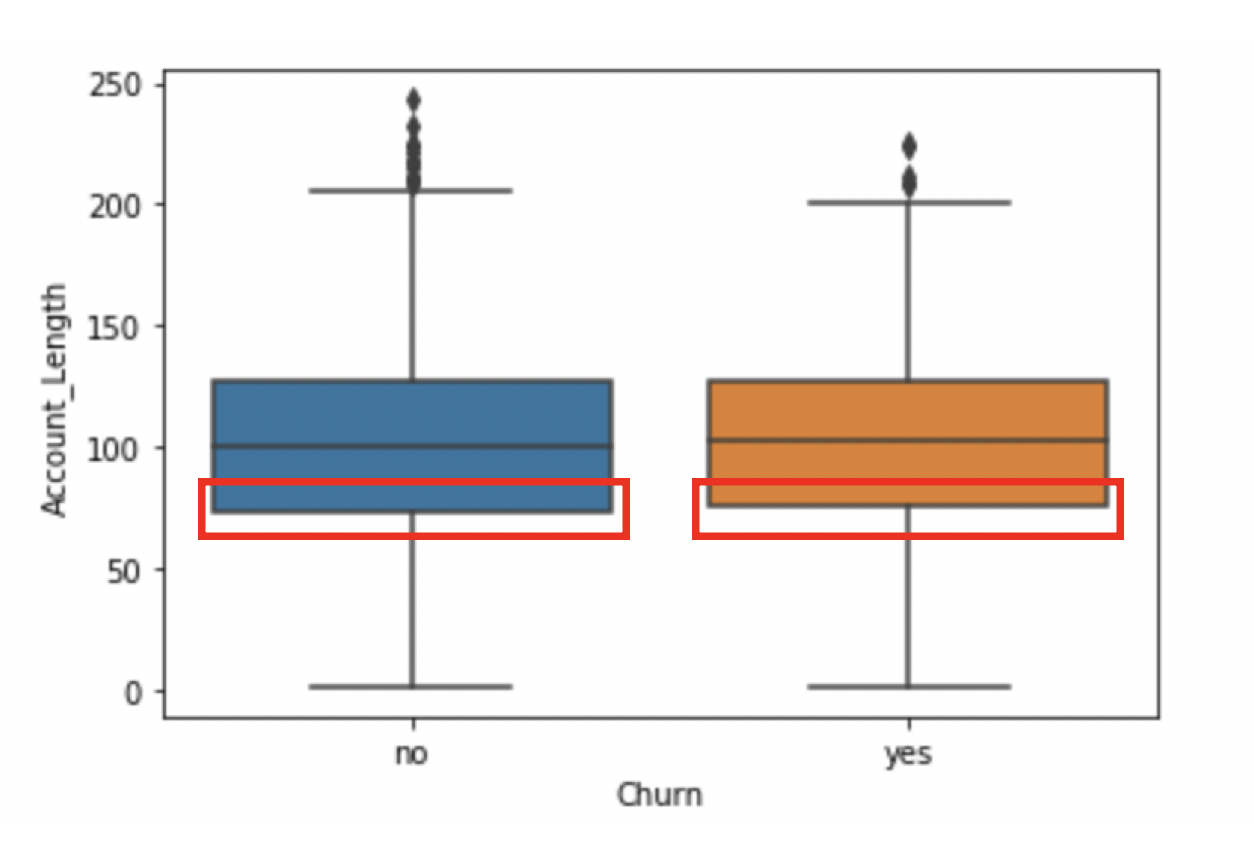
sns.boxplot(x = 'Churn',
y = 'Account_Length',
data = telco)
plt.show()

sns.boxplot(x = 'Churn',
y = 'Account_Length',
data = telco)
plt.show()

sns.boxplot(x = 'Churn',
y = 'Account_Length',
data = telco)
plt.show()

sns.boxplot(x = 'Churn',
y = 'Account_Length',
data = telco)
plt.show()

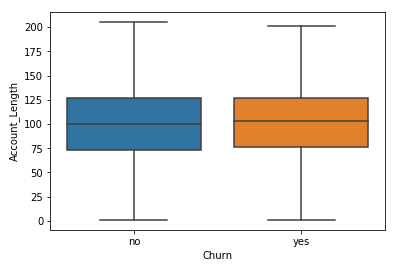
sns.boxplot(x = 'Churn',
y = 'Account_Length',
data = telco,
sym="")
plt.show()

sns.boxplot(x = 'Churn',
y = 'Account_Length',
data = telco,
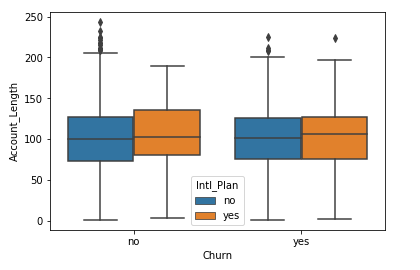
hue = 'Intl_Plan')
plt.show()

Marketing Analytics: Python में Customer Churn की भविष्यवाणी