वैकल्पिक विधि: chi-squared वितरण

R में श्रेणीबद्ध डेटा के लिए अनुमान

Andrew Bray

Assistant Professor of Statistics at Reed College

अनुमानित वितरण: normal
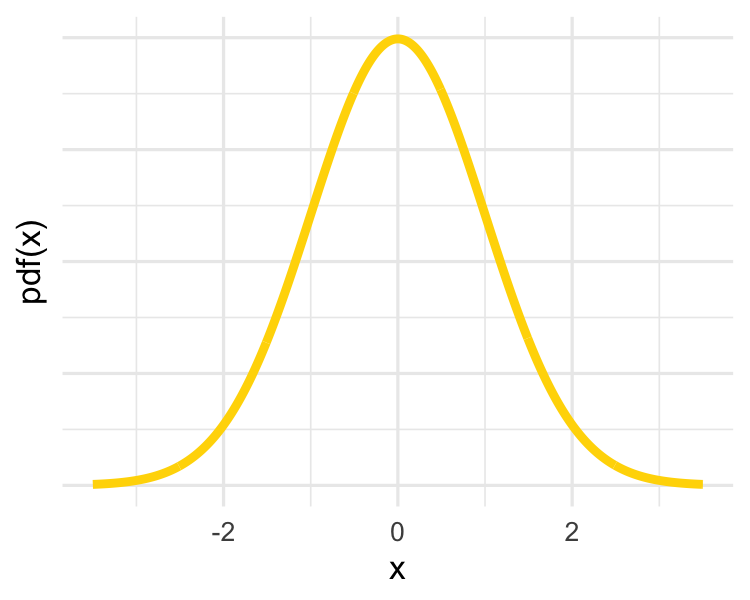
  • सांख्यिकी: $\hat{p}, \hat{p}_{1} - \hat{p}_{2}$

सामान्य वक्र

R में श्रेणीबद्ध डेटा के लिए अनुमान

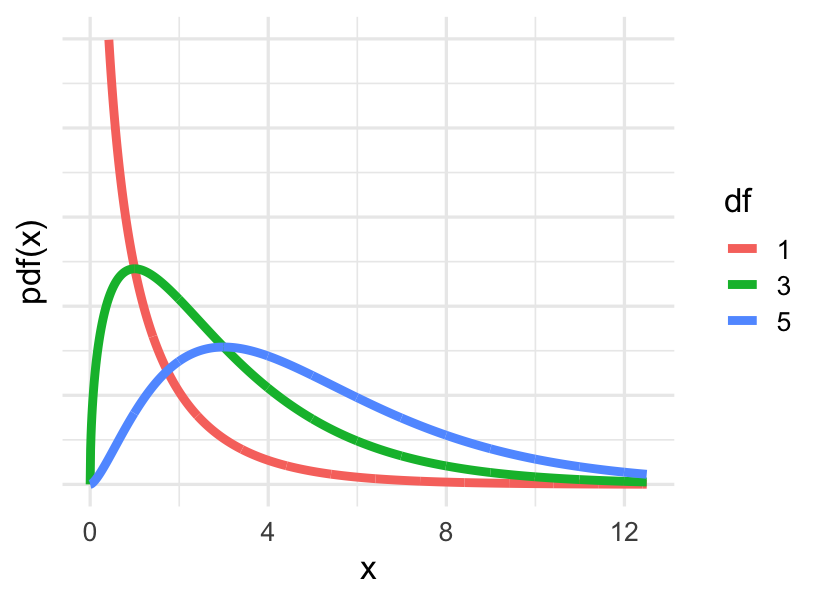
अनुमानित वितरण: chi-squared

  • सांख्यिकी: $\hat{x}^{2}$
  • आकार degrees of freedom पर निर्भर है
  • $df = (nrows - 1) \times (ncols - 1)$

chi-squared वक्र

R में श्रेणीबद्ध डेटा के लिए अनुमान

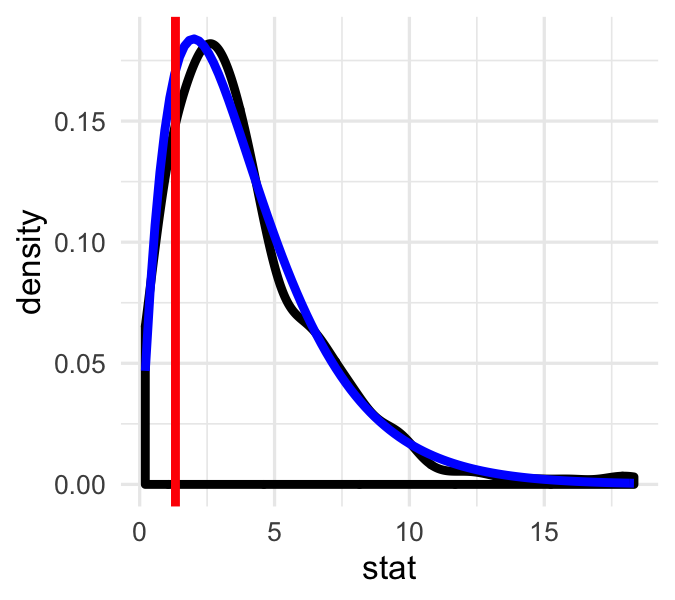
अनुमान से H-परीक्षण

null_spac <- gss_party %>%
  specify(natspac ~ party) %>%
  hypothesize(null = "independence") %>%
  generate(reps = 100, type = "permute") %>%
  calculate(stat = "Chisq")
ggplot(null_spac, aes(x = stat)) +
  geom_density() +
  stat_function(
    fun = dchisq, 
    args = list(df = 4), 
    color = "blue"
  ) +
  geom_vline(xintercept = chi_obs_spac, color = "red")

अनुमानित H-परीक्षण

R में श्रेणीबद्ध डेटा के लिए अनुमान

अनुमान से H-परीक्षण

gss_party %>%
  select(natarms, party) %>%
  table()
             party
natarms        D  I  R
  TOO LITTLE  17 20 24
  ABOUT RIGHT 14 28  8
  TOO MUCH    12 24  2
pchisq(chi_obs_spac, df = 4)
X-squared 
0.1430612
1 - pchisq(chi_obs_spac, df = 4)
X-squared 
0.8569388

अनुमानित H-परीक्षण

R में श्रेणीबद्ध डेटा के लिए अनुमान

chi-squared वितरण

अच्छा अनुमान तब बनता है जब:

  • $expected\_count >= 5$
  • $df >= 2$

chi-squared वक्र

R में श्रेणीबद्ध डेटा के लिए अनुमान

अभ्यास करते हैं!

R में श्रेणीबद्ध डेटा के लिए अनुमान

Preparing Video For Download...