लाभप्रदता मेट्रिक्स
Python में Financial Statements का विश्लेषण

Rohan Chatterjee
Risk Modeler
उच्च current ratio से उच्च लाभप्रदता?
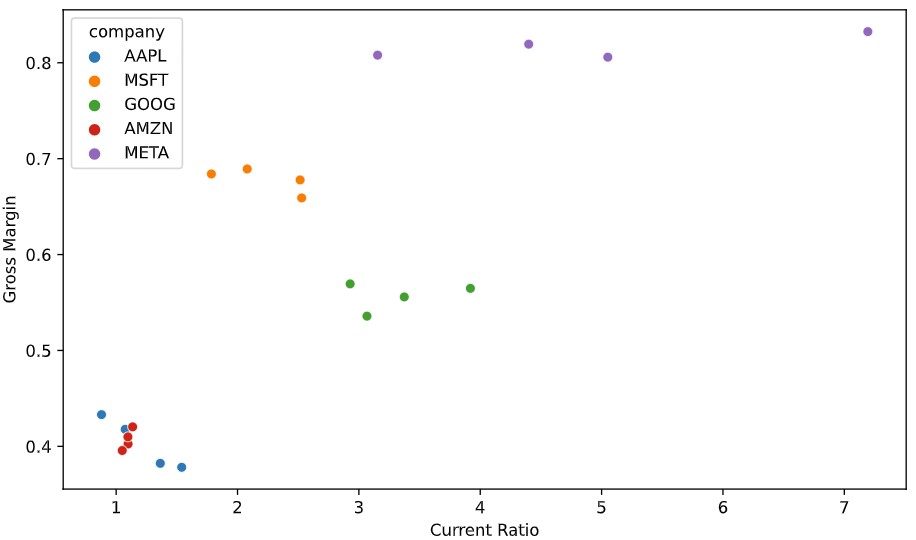
स्कैटर प्लॉट बनाएँ
sns.scatterplot(data=dataset_tech, x="current_ratio", y="gross_margin",
                hue="Company")
plt.xlabel("Current Ratio")
plt.ylabel("Gross Margin")
plt.show()
सभी कंपनियों के साथ स्कैटर प्लॉट
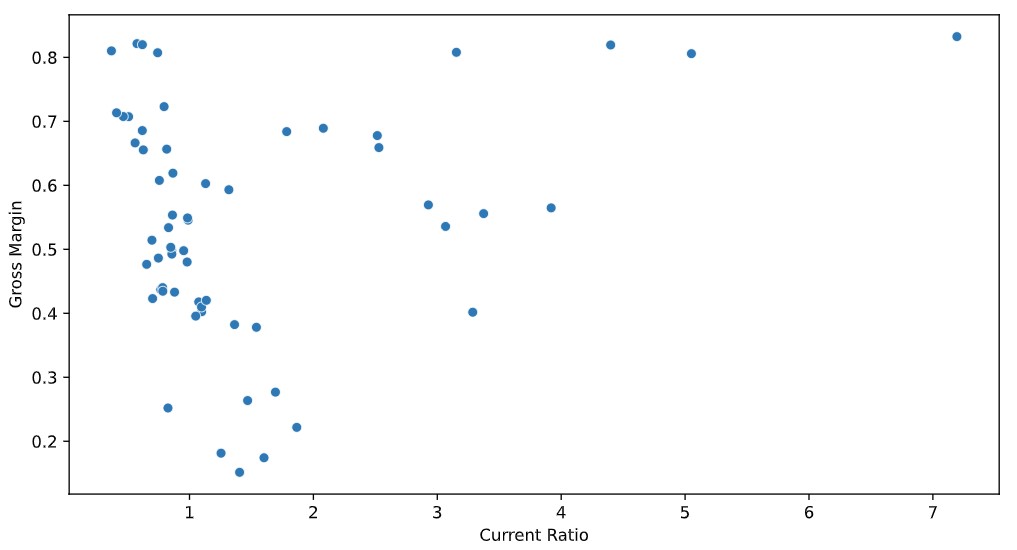
Best fit लाइन जोड़ें
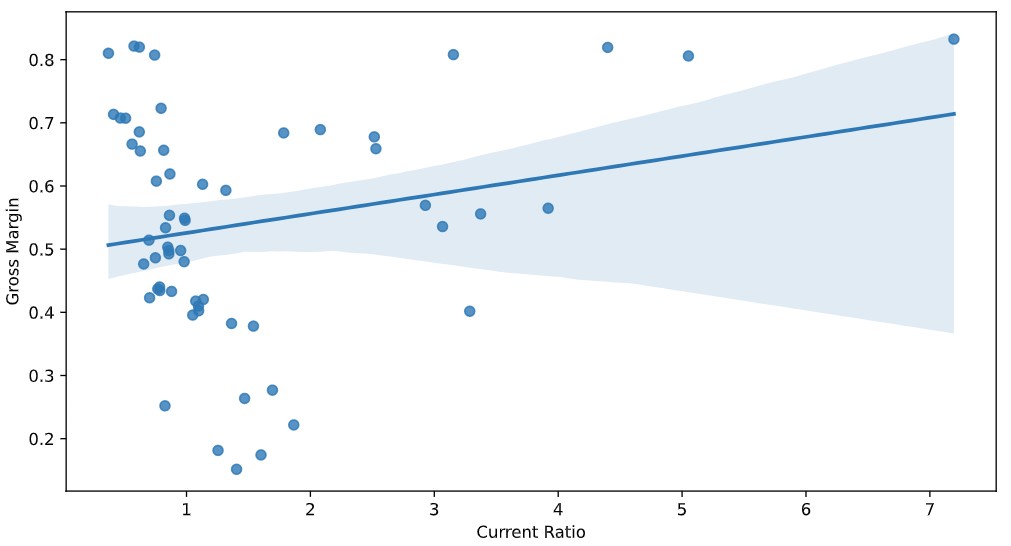
Best fit लाइन के साथ स्कैटर प्लॉट बनाएँ
sns.regplot(data=dataset_tech, x="current_ratio", y="gross_margin")
plt.xlabel("Current Ratio")
plt.ylabel("Gross Margin")
plt.show()

