Cohort विश्लेषण विज़ुअलाइज़ेशन

Python में Customer Segmentation

Karolis Urbonas

Head of Data Science, Amazon

हीटमैप
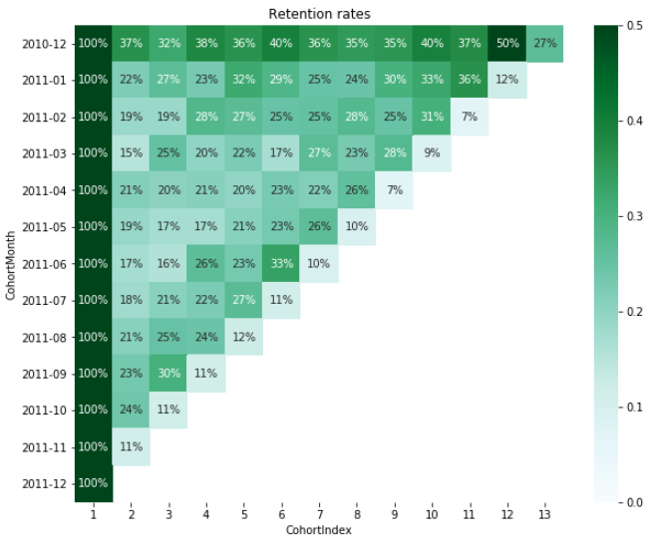
  • Cohort विश्लेषण को विज़ुअलाइज़ करने का सबसे आसान तरीका

  • डेटा और विज़ुअल दोनों शामिल

  • seaborn से सिर्फ कुछ लाइनों का कोड

cohort_heatmap

Python में Customer Segmentation

Retention टेबल लोड करें

retention.round(3)*100
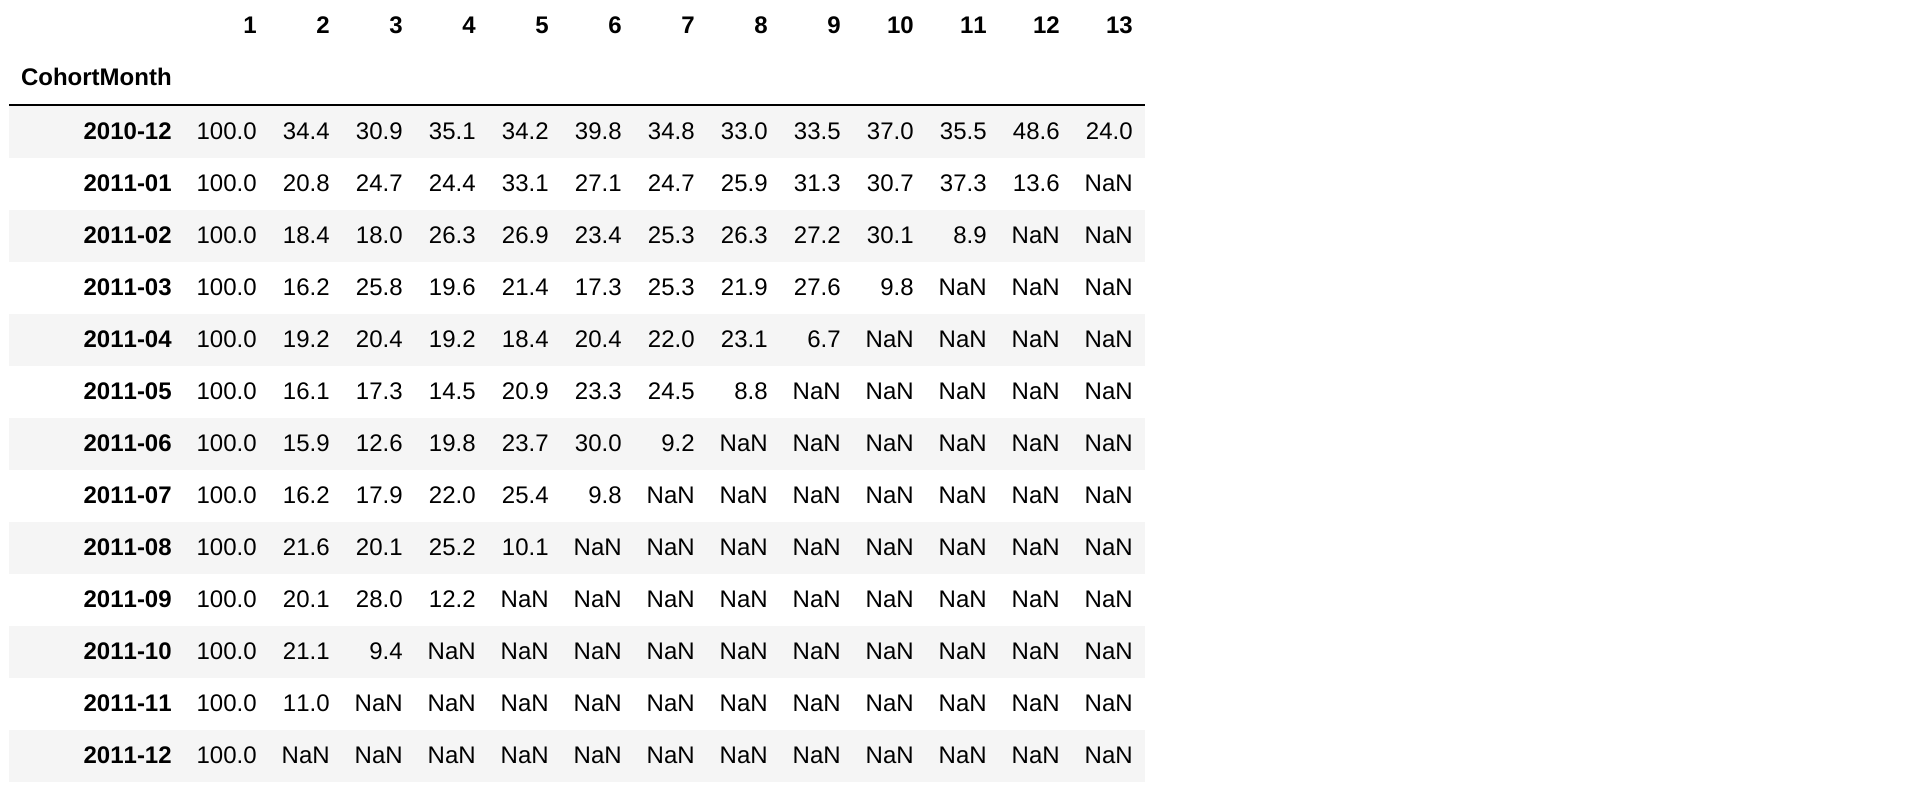
retention_table

Python में Customer Segmentation

हीटमैप बनाएँ

import seaborn as sns
import matplotlib.pyplot as plt

plt.figure(figsize=(10, 8))
plt.title('Retention rates')
sns.heatmap(data = retention, annot = True, fmt = '.0%', vmin = 0.0, vmax = 0.5, cmap = 'BuGn')
plt.show()
Python में Customer Segmentation

Retention हीटमैप

retention_heatmap

Python में Customer Segmentation

Cohorts को विज़ुअलाइज़ करने का अभ्यास

Python में Customer Segmentation

Preparing Video For Download...