Weibull मॉडल से विज़ुअलाइज़ेशन और प्रेडिक्शन

Python में Survival Analysis

Shae Wang

Senior Data Scientist

.plot()

95% कॉन्फिडेंस इंटरवल से कोएफिशिएंट्स और उनकी रेंज वाला प्लॉट रिटर्न करता है।

aft.plot()
plt.show()

सैंपल प्लॉट:
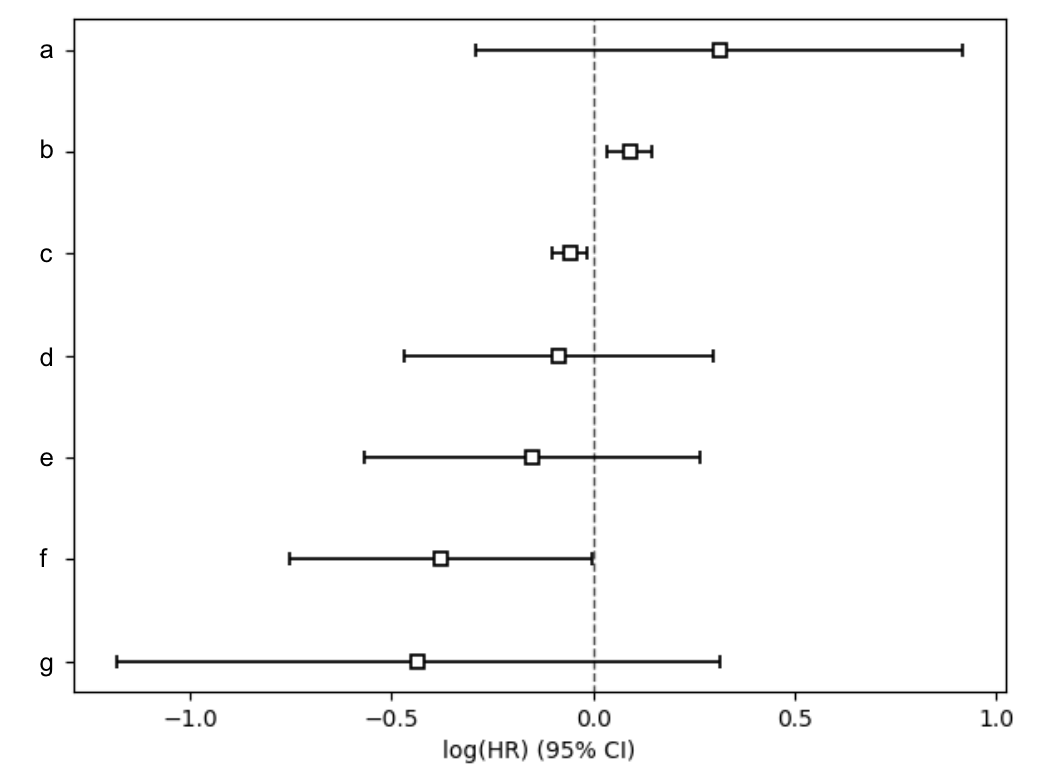
sample_covariate_plot

Python में Survival Analysis

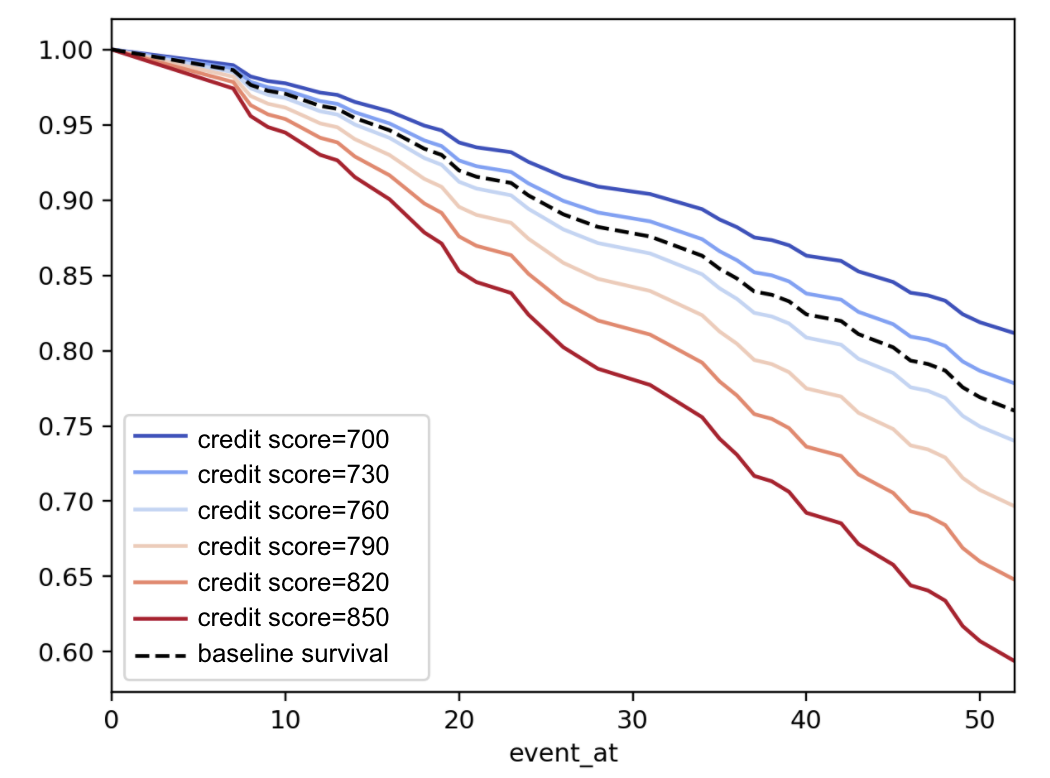
.plot_partial_effects_on_outcome()

बेसलाइन सर्वाइवल कर्व की तुलना उन कर्व्स से करने वाला प्लॉट रिटर्न करता है जब covariates के मान बदले जाते हैं।

aft.plot_partial_effects_on_outcome(covariates, values)
plt.show()
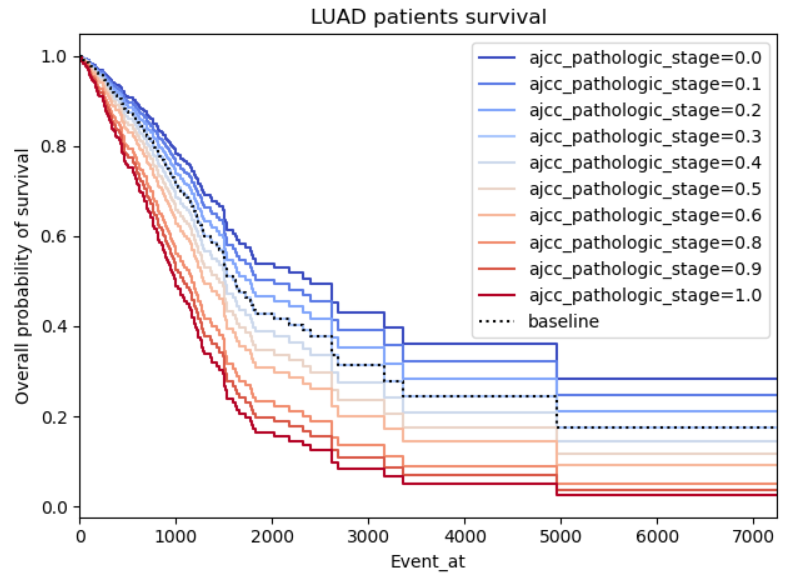
sample_partial_effects_plot

Python में Survival Analysis

Partial effects कैसे प्लॉट करें?

.plot_partial_effects_on_outcome()

  • covariates (string या list): मूल डेटासेट में वे covariate(s) जिनके मान आप बदलना चाहते हैं।
  • values (1d या 2d iterable): वे मान जो covariate लेने चाहिए।

  • Baseline survival curve: मूल डेटासेट में सभी औसत मानों पर अनुमानित सर्वाइवल कर्व।

aft.plot_partial_effects_on_outcome(
  covariates='var', 
  values=[0, 3, 6, 9, 12, 15]
)
plt.show()
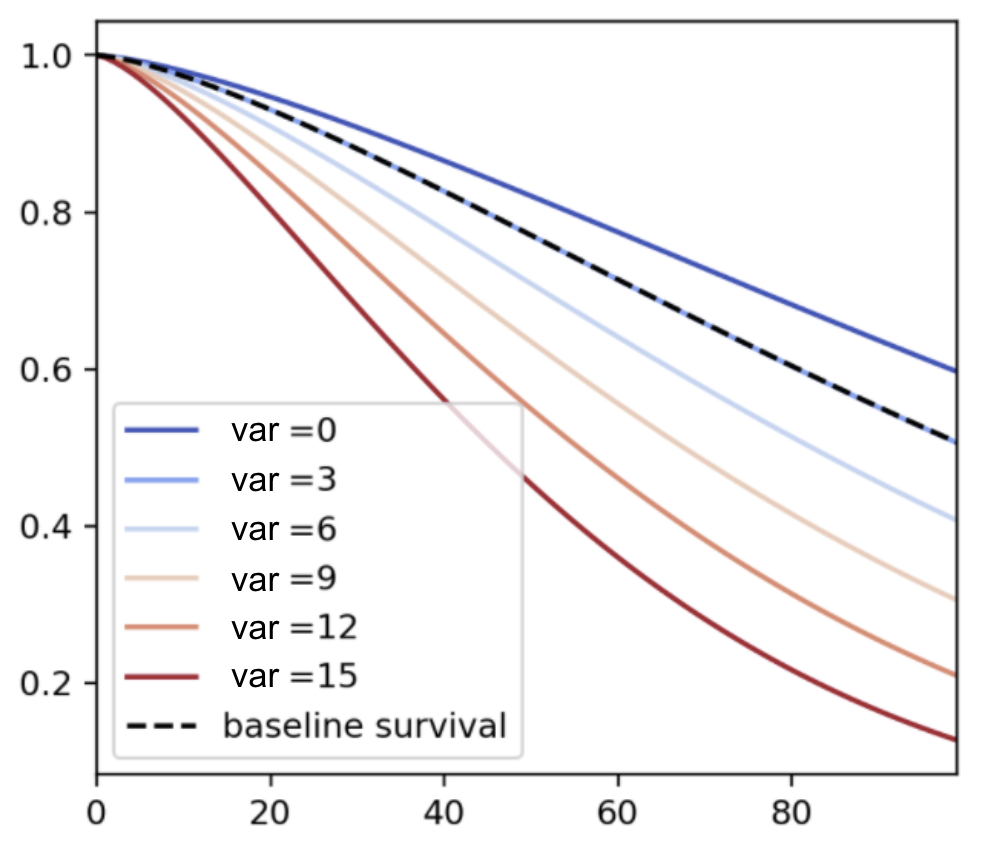
partial effects plot for weibull model

Python में Survival Analysis

Partial effects कैसे प्लॉट करें?

  • मान हार्ड-कोड करें:
    aft.plot_partial_effects_on_outcome(
      covariates='a', 
      values=[0, 3, 6]
    )
    
  • range फंक्शन इस्तेमाल करें:
    aft.plot_partial_effects_on_outcome(
      covariates='a', 
      values=np.arange(10)
    )
    
  • एक से अधिक covariates:
    aft.plot_partial_effects_on_outcome(
      covariates=['a','b'], 
      values=[[1,2],[1,3],[2,3]]
    )
    
  • कस्टम फॉर्मूला:
    • जरूरी transformations (interactions, one-hot encoding, आदि) अंदर ही ऑटोमेटिक हो जाएँगी।
Python में Survival Analysis

Mortgage उदाहरण

DataFrame उदाहरण: mortgage_df

id house principal interest property_tax credit score duration paid_off
1 1 1275 0.035 0.019 780 25 0
2 0 756 0.028 0.020 695 17 1
3 0 968 0.029 0.017 810 5 0
... ... ... ... ... ... ... ...
1000 1 1505 0.041 0.023 750 30 1
Python में Survival Analysis

Mortgage उदाहरण

aft.plot_partial_effects_on_outcome(
    covariates='credit score',
    values=np.arange(700, 860, 30)
)
plt.show()

partial effects plot for mortgage_df

Python में Survival Analysis

Survival functions प्रेडिक्ट करें

  • covariates के मानों के आधार पर सर्वाइवल कर्व बदलते हैं। prediction flowchart
Python में Survival Analysis

Survival functions प्रेडिक्ट करें

covariate मानों के आधार पर व्यक्तियों की survival functions प्रेडिक्ट करें।

.predict_survival_function()

Arguments:

  • X (np array या DataFrame): covariates। DataFrame होने पर कॉलम का क्रम कोई भी हो सकता है।

covariate मानों के आधार पर व्यक्तियों की median survival durations प्रेडिक्ट करें।

.predict_median()

Arguments:

  • df (np array या DataFrame): covariates। DataFrame होने पर कॉलम का क्रम कोई भी हो सकता है।
Python में Survival Analysis

Current durations के बाद कंडीशनल

वर्तमान duration के बाद कंडीशनल रूप से survival function या median survival duration प्रेडिक्ट करें।

  • .predict_survival_function(X, conditional_after)
  • .predict_median(df, conditional_after)

उदाहरण:

aft.predict_median(new_subject)
4.0
aft.predict_median(new_subject, conditional_after=[2])
2.0
Python में Survival Analysis

अभ्यास करते हैं!

Python में Survival Analysis

Preparing Video For Download...