Python में Survival Analysis
Shae Wang
Senior Data Scientist
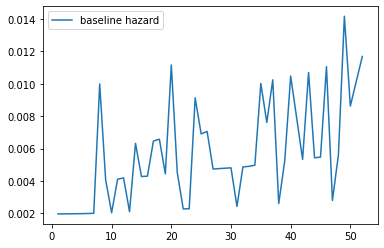
lifelines में median)model.baseline_hazard_.plot()
plt.show()
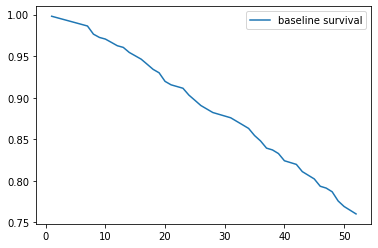
model.baseline_survival_.plot()
plt.show()
| Calculation | Example | |
|---|---|---|
| Coefficient | $x$ | $0.405$ |
| Hazard ratio | $e^x$ | $e^{0.405}=1.5$ |
| Hazards interpretation | $e^x-1$ | $1.5-1 = 0.5$ -> hazards में 50% वृद्धि |
| Survival time interpretation | $\frac{1}{e^x}-1$ | $\frac{1}{1.5}-1 = 0.67-1 = -0.23$ -> survival time में 23% कमी |
.plot_partial_effects_on_outcome()
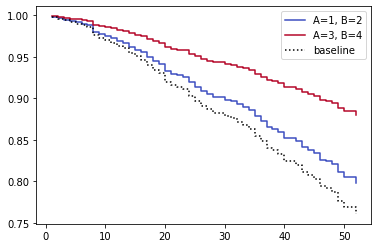
covariates (string या list): मूल डेटासेट में वे covariate नाम जिन्हें आप बदलना चाहते हैं.values (1d या 2d iterable): वे मान जिन्हें covariates को देना है.मॉडल में covariates A, B, C हैं, और हम बदलना चाहते हैं
A को 1, 2 परB को 3, 4 परmodel.plot_partial_effects_on_outcome(
covariates=["A","B"],
values=[[1,2],
[3,4]]
)
plt.show()

गलत...
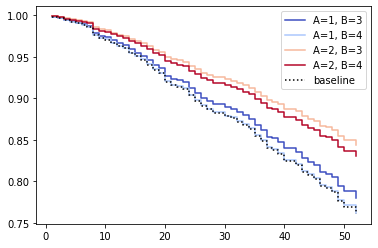
मॉडल में covariates A, B, C हैं, और हम बदलना चाहते हैं
A को 1, 2 परB को 3, 4 परmodel.plot_partial_effects_on_outcome(
covariates=["A","B"],
values=[[1,3],
[1,4],
[2,3],
[2,4]]
)
plt.show()

सही!
Python में Survival Analysis