डॉट प्लॉट को पॉलिश करना

Tidyverse में डेटा के साथ संवाद

Timo Grossenbacher

Data Journalist
Tidyverse में डेटा के साथ संवाद

Factor levels

  • फैक्टर की levels का क्रम ggplot2 में दिखने के क्रम को तय करता है.
ilo_data$country
Austria        Belgium        Czech Rep.     Finland       
France         Germany        Hungary    ...
 ...
 17 Levels: Austria Belgium Czech Rep. Finland France ... United Kingdom
Tidyverse में डेटा के साथ संवाद

forcats पैकेज से फैक्टर रीऑर्डर करना

  • library(forcats) से पैकेज लोड करें.
  • लेवल हटाने के लिए fct_drop.
  • लेवल उलटने के लिए fct_rev.
  • दोबारा क्रम देने के लिए fct_reorder.

1 और जानें: tidyverse.org (http://forcats.tidyverse.org/)

Tidyverse में डेटा के साथ संवाद

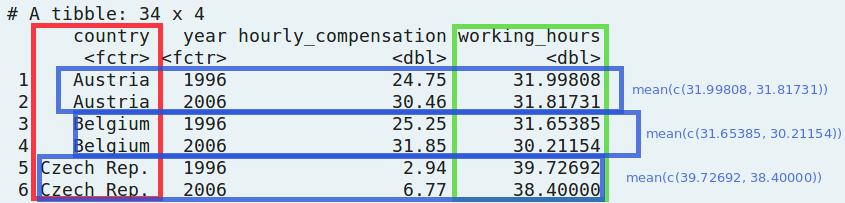
`fct_reorder` फंक्शन

ilo_data
# A tibble: 34 x 4
      country   year hourly_compensation working_hours
        <fct>  <fct>               <dbl>         <dbl>
 1    Austria   1996               24.75      31.99808
 2    Austria   2006               30.46      31.81731
 3    Belgium   1996               25.25      31.65385
 4    Belgium   2006               31.85      30.21154
ilo_data <- ilo_data  %>% 
    mutate(country = fct_reorder(country, working_hours, mean))
ilo_data$country
17 Levels: Netherlands Norway Germany Sweden ... Czech Rep.
Tidyverse में डेटा के साथ संवाद

Tidyverse में डेटा के साथ संवाद

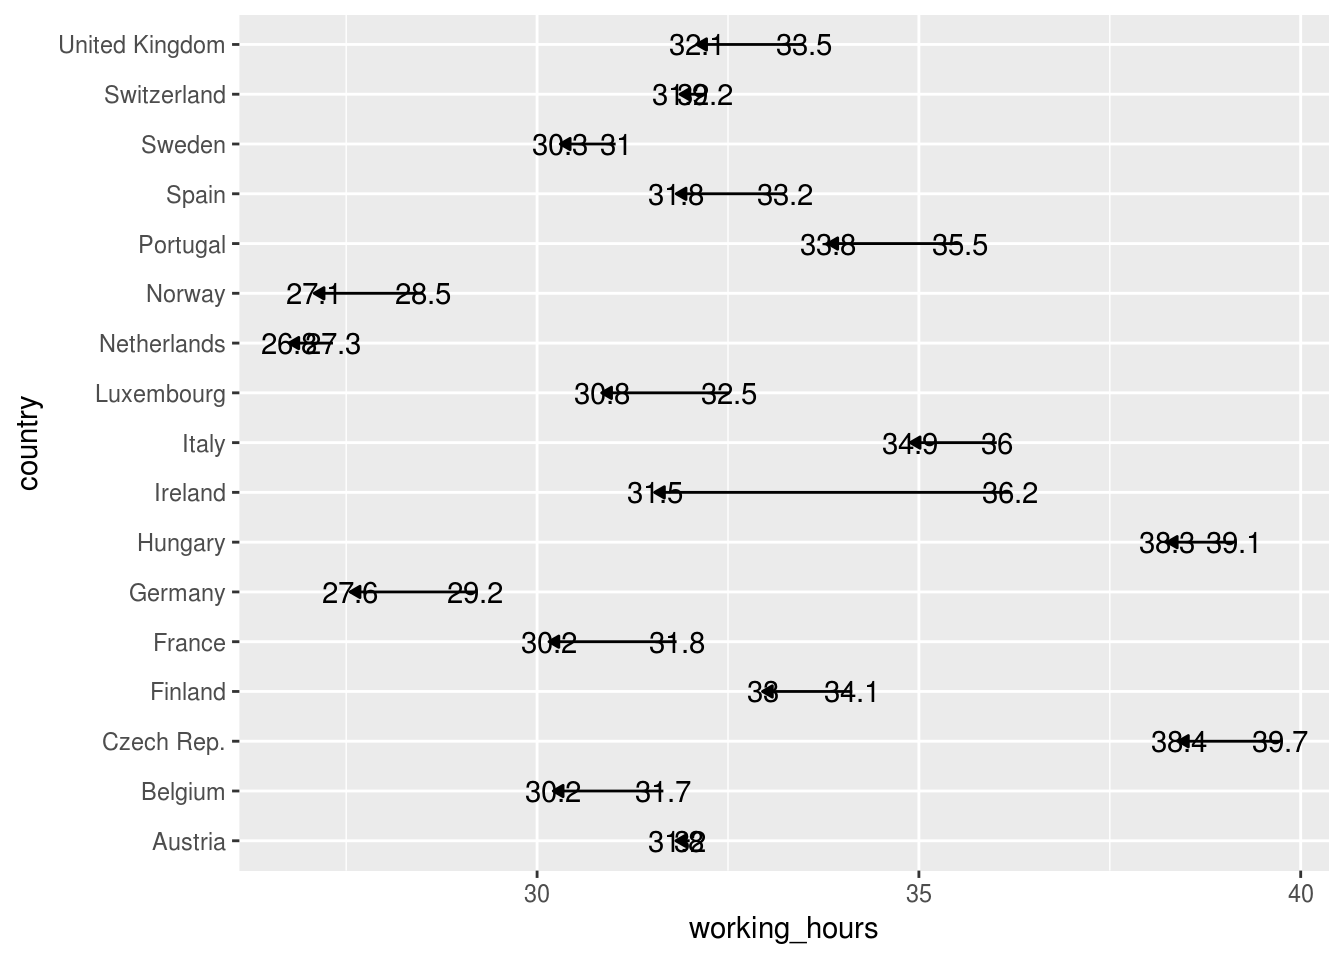
hjust और vjust से लेबल को थोड़ा खिसकाना

ggplot(ilo_data) +
  geom_path(aes(...)) +
  geom_text(
        aes(...,
            hjust = ifelse(year == "2006", 
              1.4, 
              -0.4)
        )
    )
Tidyverse में डेटा के साथ संवाद

अभ्यास करते हैं!

Tidyverse में डेटा के साथ संवाद

Preparing Video For Download...