आपका पहला shinydashboard

shinydashboard के साथ डैशबोर्ड बनाना

Png Kee Seng

Researcher

अब तक की राह

  • यूज़र इंटरफेस (UI) में वायरफ्रेमिंग
    • हेडर, साइडबार, बॉडी
  • आउटपुट और उनके यूज़र इनपुट से इंटरैक्शन तय करें
  • यह काम server करेगा

ड्राइंग

header <- dashboardHeader(...)
sidebar <- dashboardSidebar(...)
body <- dashboardBody(...)

ui <- dashboardPage(header, sidebar, body)
server <- function(input, output) { ... }
shinyApp(ui, server)
shinydashboard के साथ डैशबोर्ड बनाना

server

  • आउटपुट और इनपुट तय करने हैं
  • आउटपुट और उनका यूज़र इनपुट से इंटरैक्शन स्पेसिफाई करें
  • अपने helper functions बनाना उपयोगी है: अव्यवस्था घटेगी, पढ़ना आसान होगा
    • इन helper functions को कोड के शीर्ष पर रखें

server वैसा मददगार वेटर है जो आपके निर्देश किचन तक पहुँचाता है. shinyApp में server R को बताता है कि inputs का outputs से कैसे इंटरैक्शन हो.

shinydashboard के साथ डैशबोर्ड बनाना

एक plot जोड़ना

  • ग्लोबल सॉकर टूर्नामेंट डैशबोर्ड पर लौटते हैं
  • team 1 के लिए एक hexbin plot जोड़ें
  • फिर इस plot को server में रखें
  • अगर हमें team 2 के लिए वही plot चाहिए तो?
soccer %>%
  ggplot(aes(x=`1_passes_compeletd`, 
             y=`1_goal_prevented`)) +
  geom_hex(bins=10) + theme_classic()
server <- function(input, output){
  output$plot1 <- renderPlot({
  fifa %>%
    ggplot(aes(x=`1_passes_compeletd`, 
               y=`1_goal_prevented`)) +
    geom_hex(bins=10) + theme_classic()
  })
}
shinydashboard के साथ डैशबोर्ड बनाना

server के भीतर ggplot ऑब्जेक्ट परिभाषित करना

server <- function(input, output) {
  output$plot1 <- renderPlot({
    if (input$team == 1){

fifa %>% ggplot(aes(x=`1_passes_compeletd`, y=`1_goal_prevented`)) + geom_hex(bins=10) + theme_classic()
} else if (input$team == 2){
fifa %>% ggplot(aes(x=`2_passes_compeletd`, y=`2_goal_prevented`)) + geom_hex(bins=10) + theme_classic()
} }) }
shinydashboard के साथ डैशबोर्ड बनाना

helper functions का उपयोग

plot_hex <- function(team){
  if (team == 1){
    soccer %>% ggplot(aes(x=`1_passes_compeletd`, 
                        y=`1_goal_prevented`)) +
      geom_hex(bins=10) + theme_classic()
  }
  else if (team == 2){
    soccer %>% ggplot(aes(x=`2_passes_compeletd`, 
                        y=`2_goal_prevented`)) +
      geom_hex(bins=10) + theme_classic()
  }
}
shinydashboard के साथ डैशबोर्ड बनाना

helper functions का उपयोग

helper function के साथ

server <- function(input, output) {
  output$plot1 <- renderPlot(plot_hex(input$team)) 
}
  • क्या यह ज़्यादा readable नहीं है?

helper function के बिना

server <- function(input, output) {
  output$plot1 <- renderPlot({
    if (input$team == 1){
      soccer %>% ggplot(aes(x=`1_passes_compeletd`, 
              y=`1_goal_prevented`)) +
        geom_hex(bins=10) + theme_classic()
      }
    else if (input$team == 2){
      soccer %>% ggplot(aes(x=`2_passes_compeletd`, 
              y=`2_goal_prevented`)) +
        geom_hex(bins=10) + theme_classic()
      }
    })
}
shinydashboard के साथ डैशबोर्ड बनाना

सभी हिस्सों को जोड़ना

# A complete shinydashboard

header <- dashboardHeader(title = "Soccer tournament")
sidebar <- dashboardSidebar(sidebarMenu(menuItem("Passes/goals", tabName = "passtab"), menuItem("Empty", tabName = "emptytab")))
body <- dashboardBody(tabItems( tabItem("passtab", fluidRow(box(selectInput("team", "Team number", choices = c(1,2))), box(plotOutput("plot1"))) ), tabItem("emptytab")) )
ui <- dashboardPage(header, sidebar, body)
server <- function(input, output) { output$plot1 <- renderPlot(plot_hex(input$team)) }
shinyApp(ui, server)
shinydashboard के साथ डैशबोर्ड बनाना

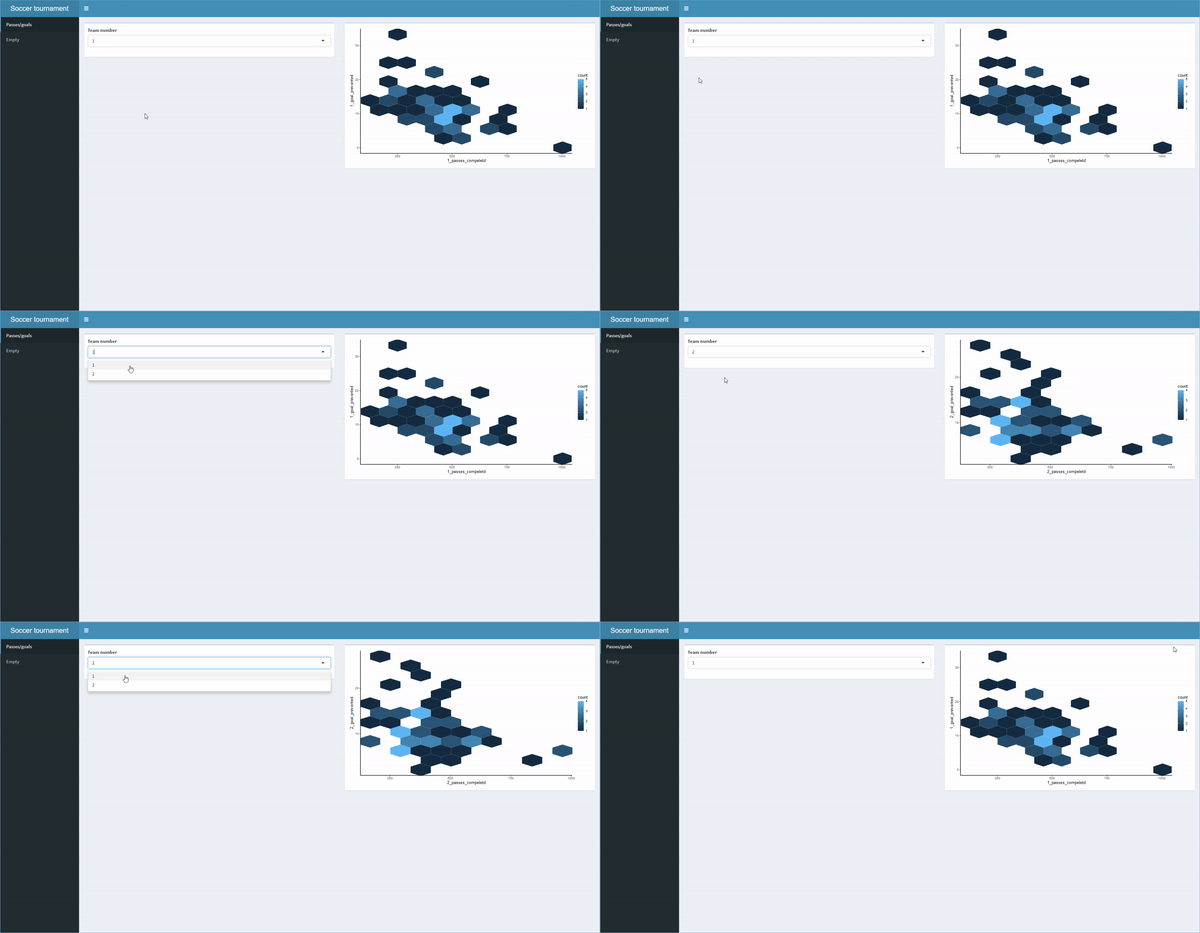
एक एनीमेशन जो रेंडर हुआ shinydashboard दिखाता है. देखें, यूज़र अलग पेज/टैब पर स्विच कर सकता है, और अलग इनपुट देकर अलग आउटपुट पा सकता है.

shinydashboard के साथ डैशबोर्ड बनाना

अभ्यास करते हैं!

shinydashboard के साथ डैशबोर्ड बनाना

Preparing Video For Download...