shinydashboard के साथ डैशबोर्ड बनाना
Png Kee Seng
Researcher
हम लंदन की एक टूर एजेंसी में काम करते हैं.
टूरिस्ट्स को रहने की जगह चाहिए.
हम उनकी कैसे मदद करें?


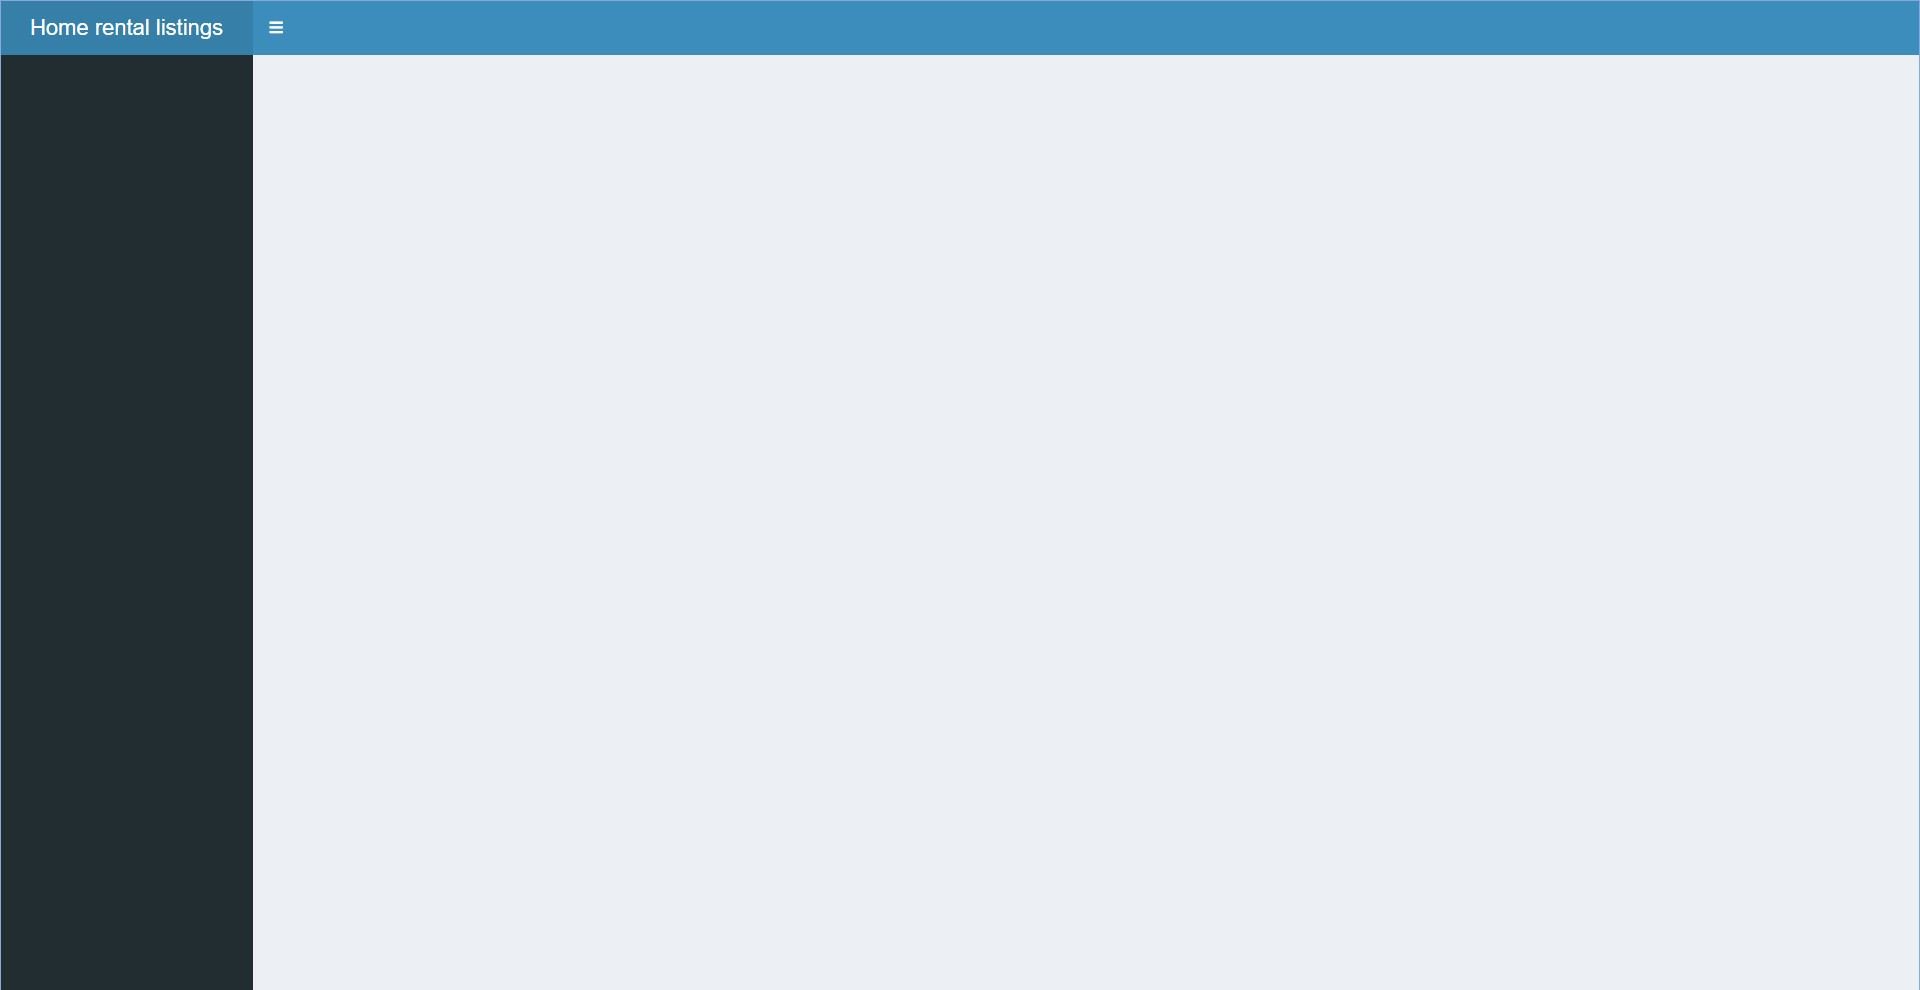
header <- dashboardHeader(
title = "Home rental listings")
sidebar <- dashboardSidebar()
body <- dashboardBody()
ui <- dashboardPage(header,
sidebar,
body)
server <- function(input, output) {}
shinyApp(ui, server)
body में:
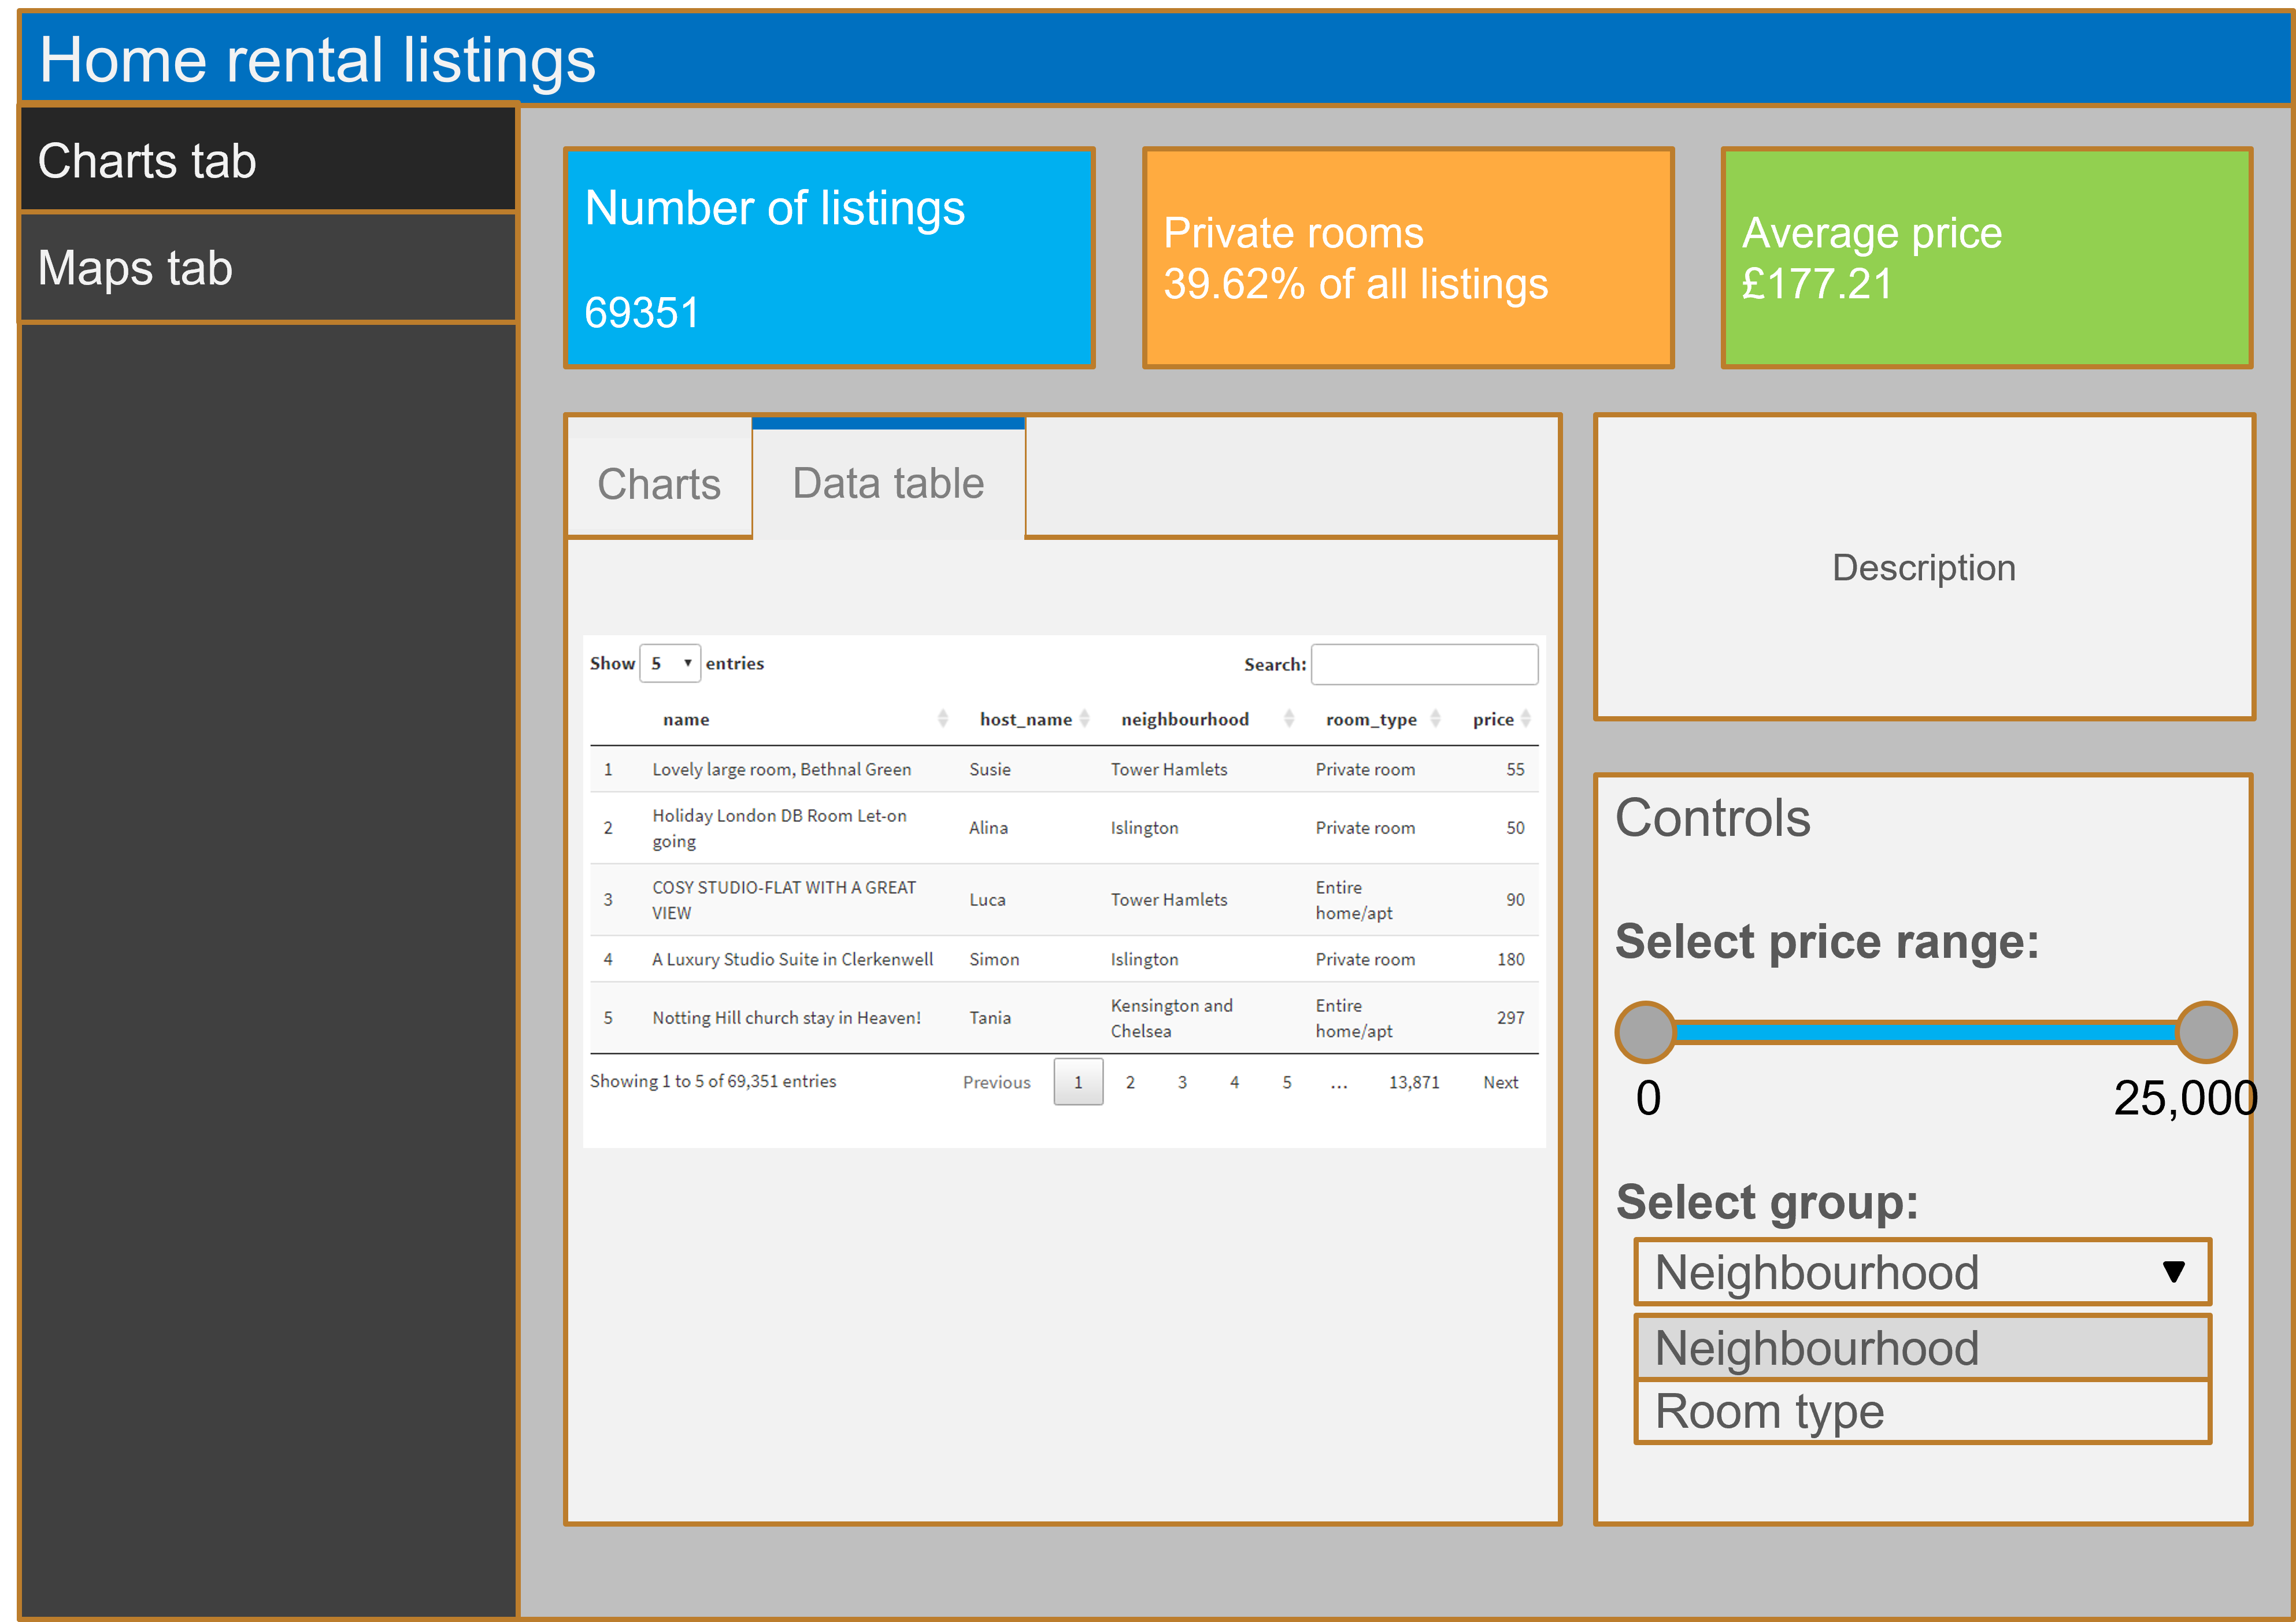
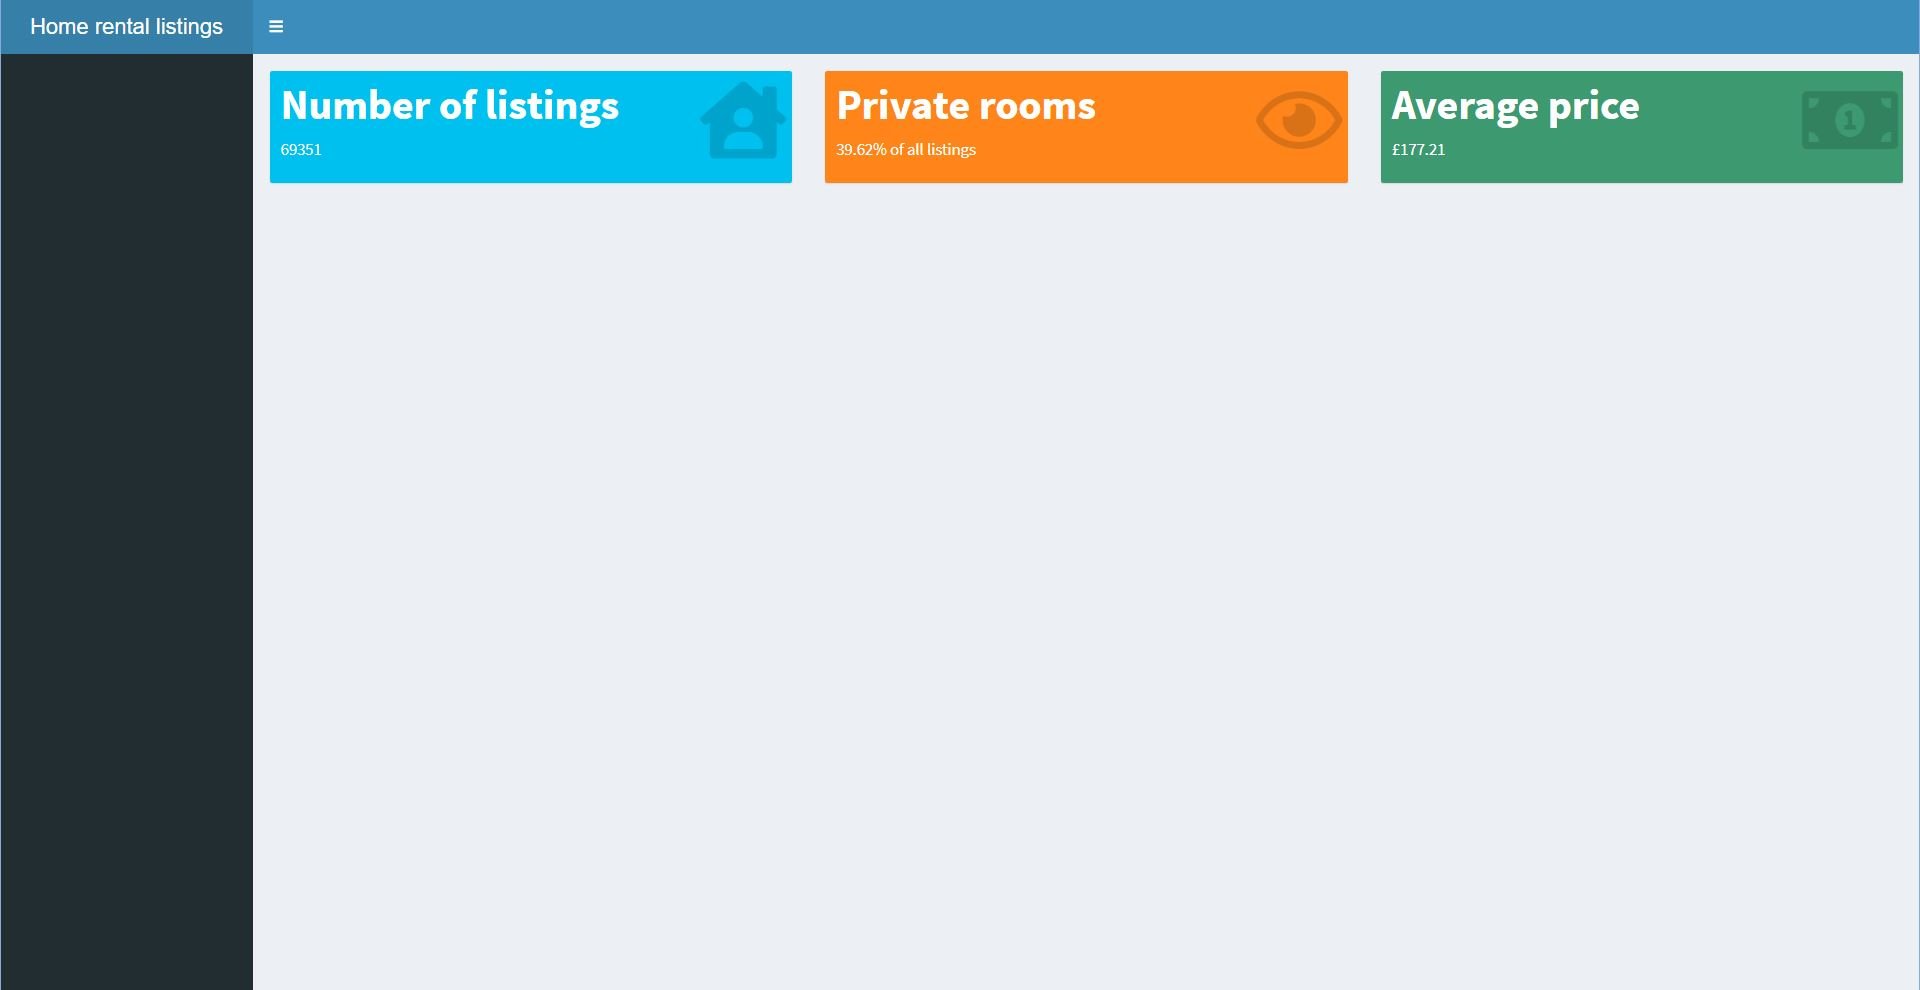
fluidRow(
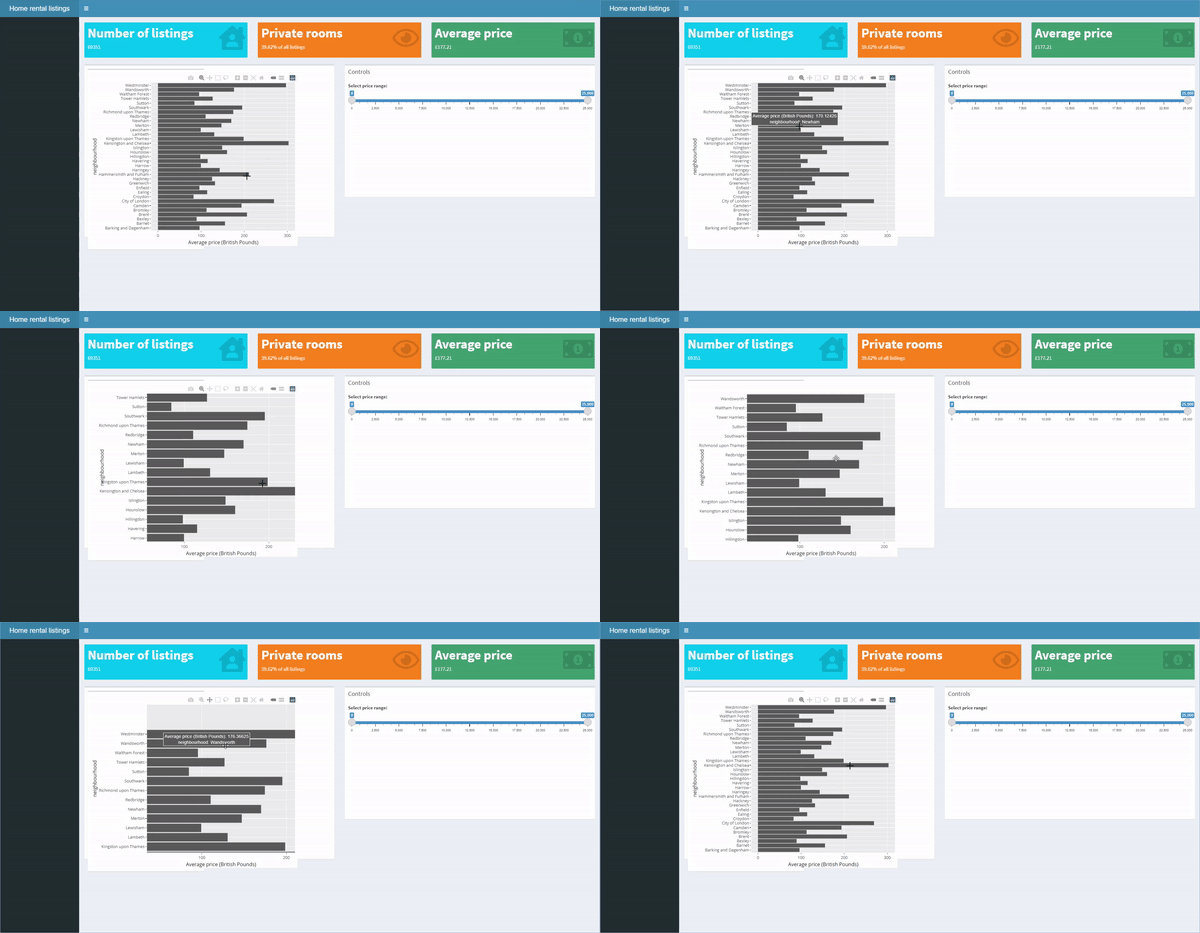
valueBoxOutput(outputId = "count"),
valueBoxOutput(outputId = "prop"),
valueBoxOutput(outputId = "avg"))
server में:
output$count <- renderValueBox({
valueBox(..., icon = ...)})
output$prop <- renderValueBox(...)
...
body में:
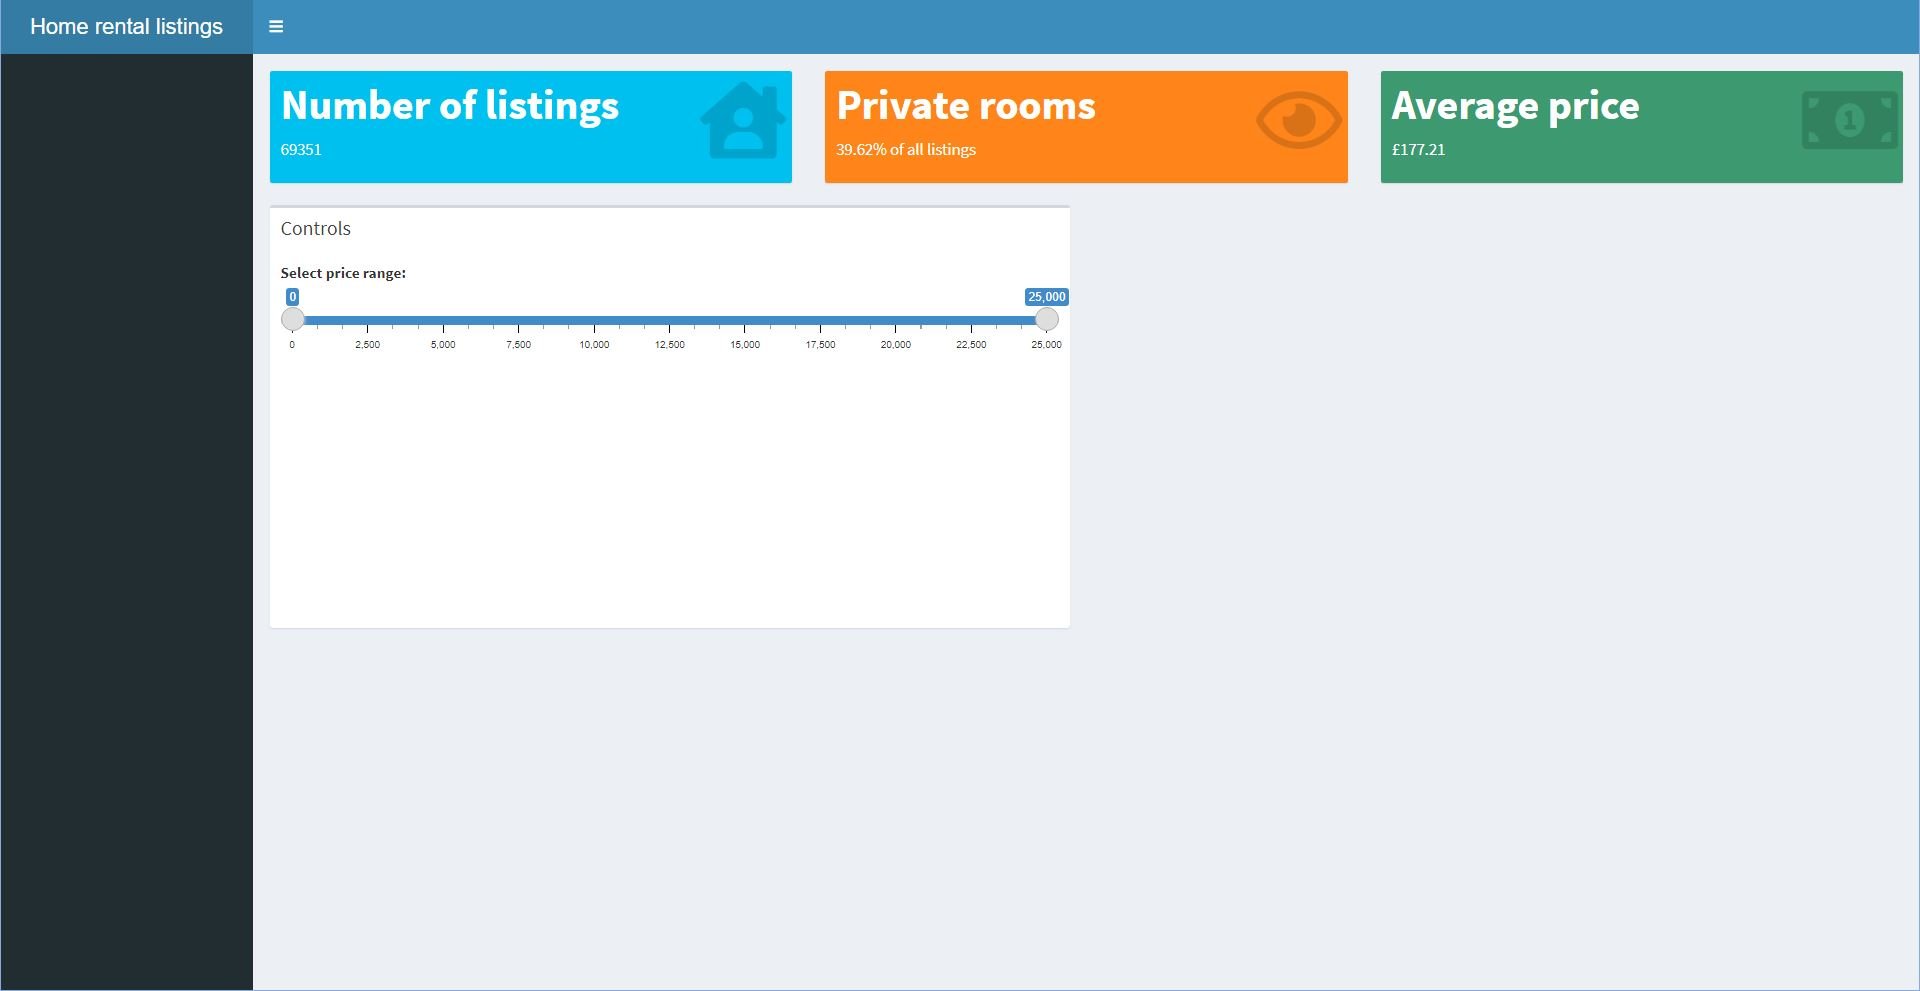
box(
side = "right", ...,
sliderInput(inputId = "range",
label = "Select price range:",
min = 0,
max = 25000,
value = c(0,25000))
))
server अपडेट करें, input$range[1] और input$range[2] का उपयोग करें

body में:
plotlyOutput("plots",
height = 500,
width = 600)
server में:
output$plots <- renderPlotly({
...
})

body में:
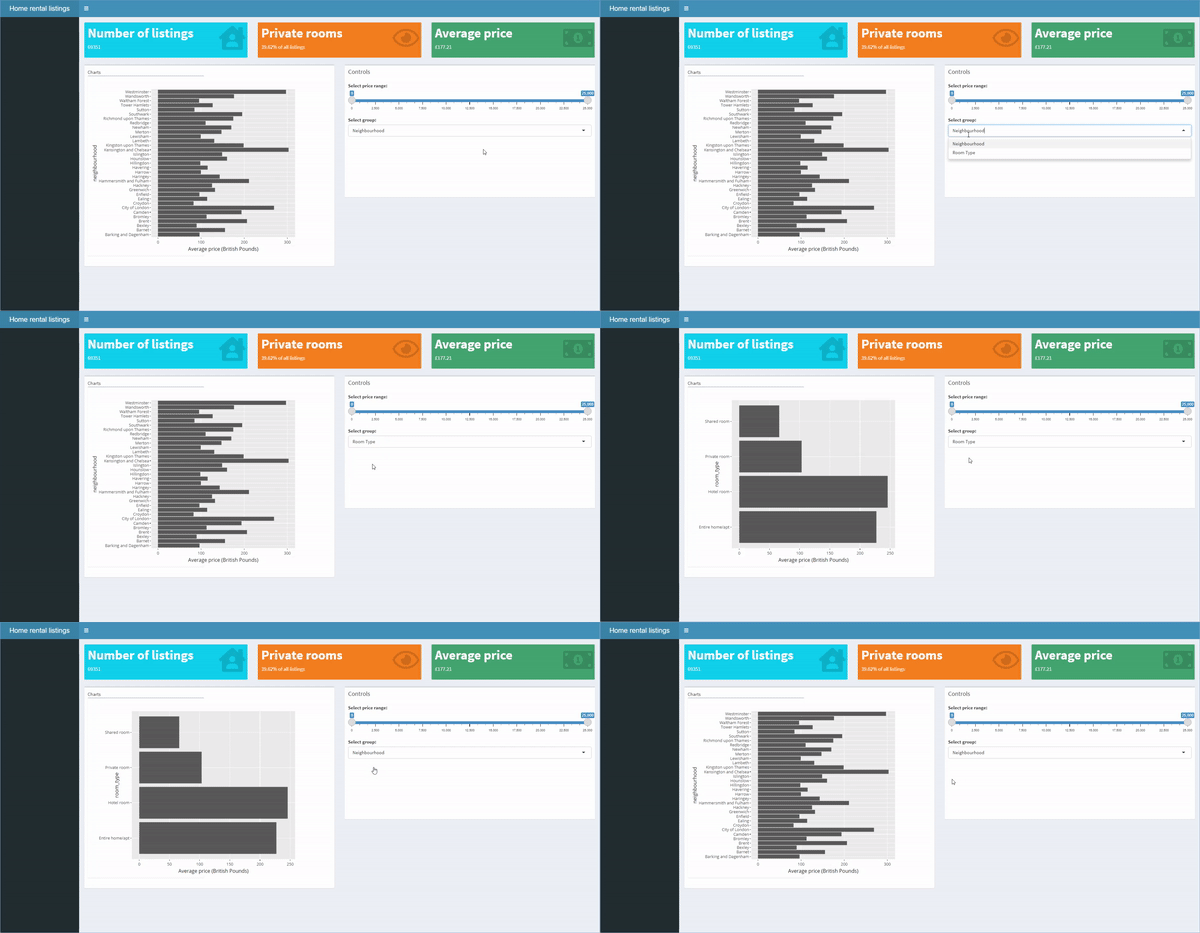
selectInput(inputId = "select",
label = "Select group:",
choices = c("Neighbourhood",
"Room Type"))
server में:
output$plots <- renderPlotly({
if (input$select == ...){plot1}
else if(input$select == ...){plot2}
})
body में:
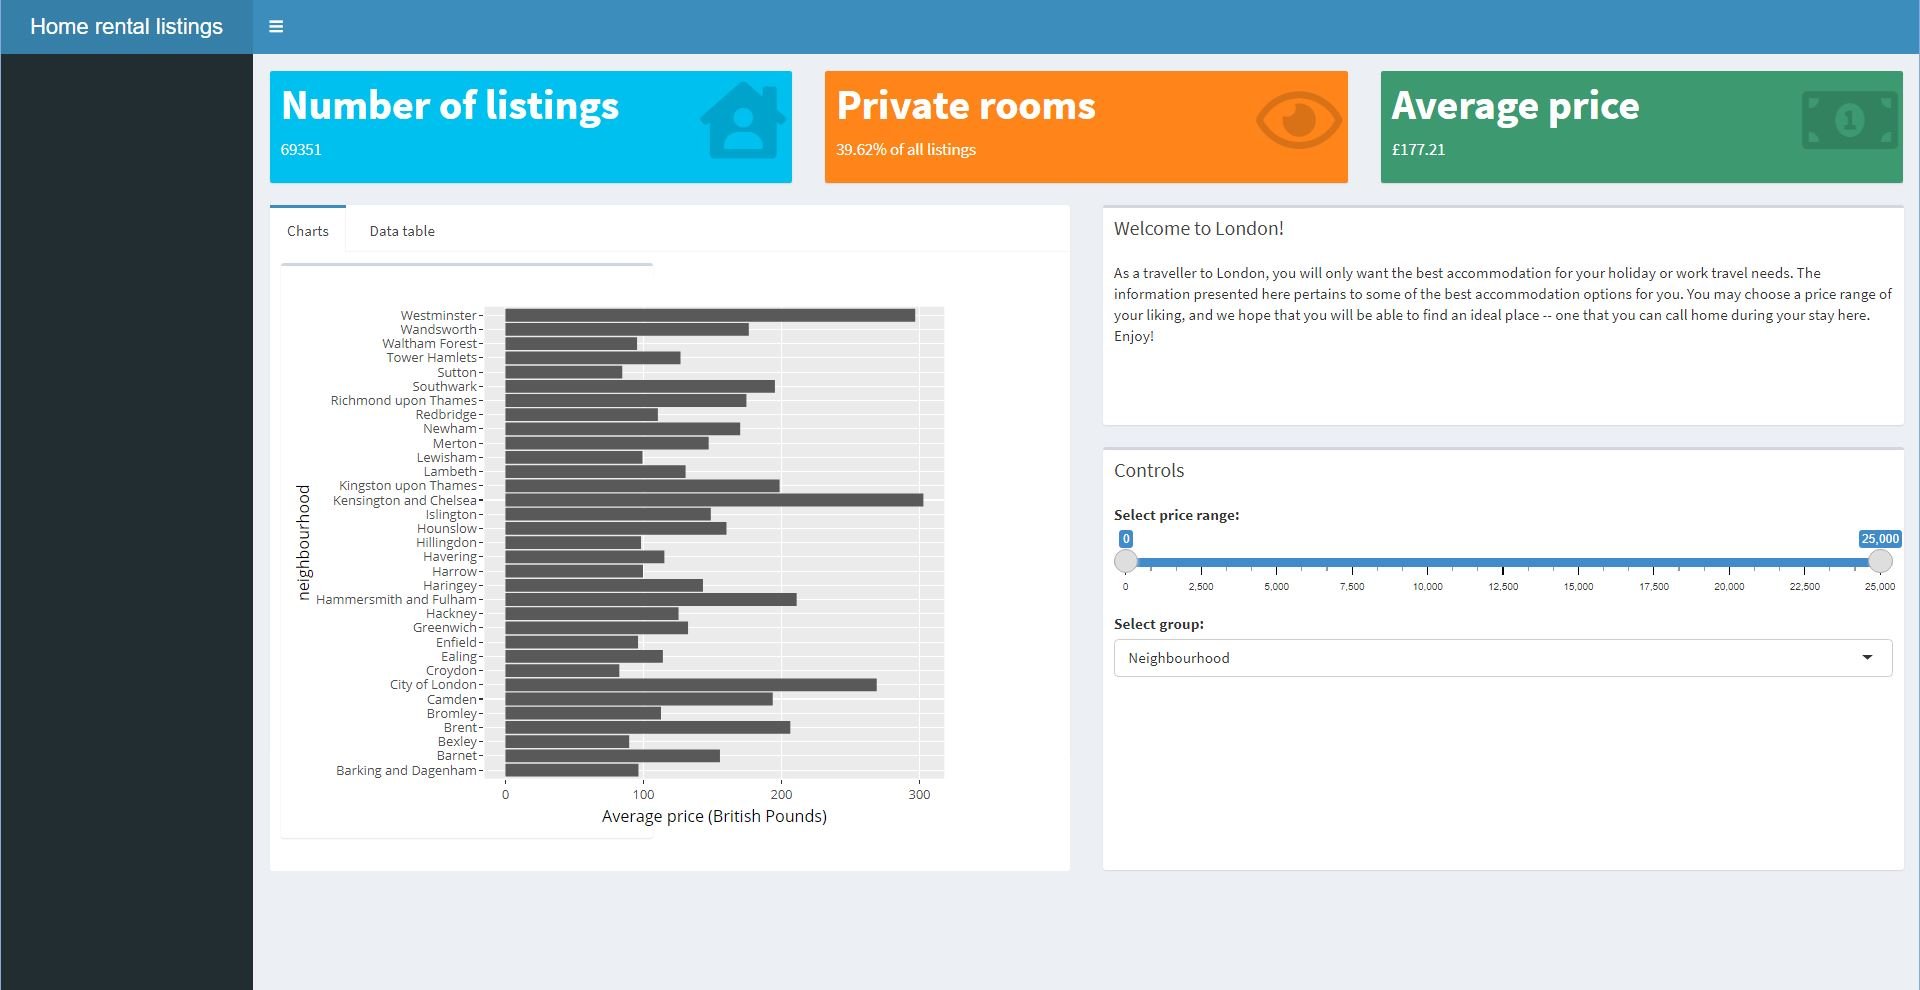
box(side = "right", ...,
title = "Welcome to London!",
"...")
body में अपडेट:
tabBox(id = "tabset", ...,
tabPanel("Charts", ...),
tabPanel("Data table", ...)

हम shiny फंक्शन का उपयोग कर सकते हैं.
body में:
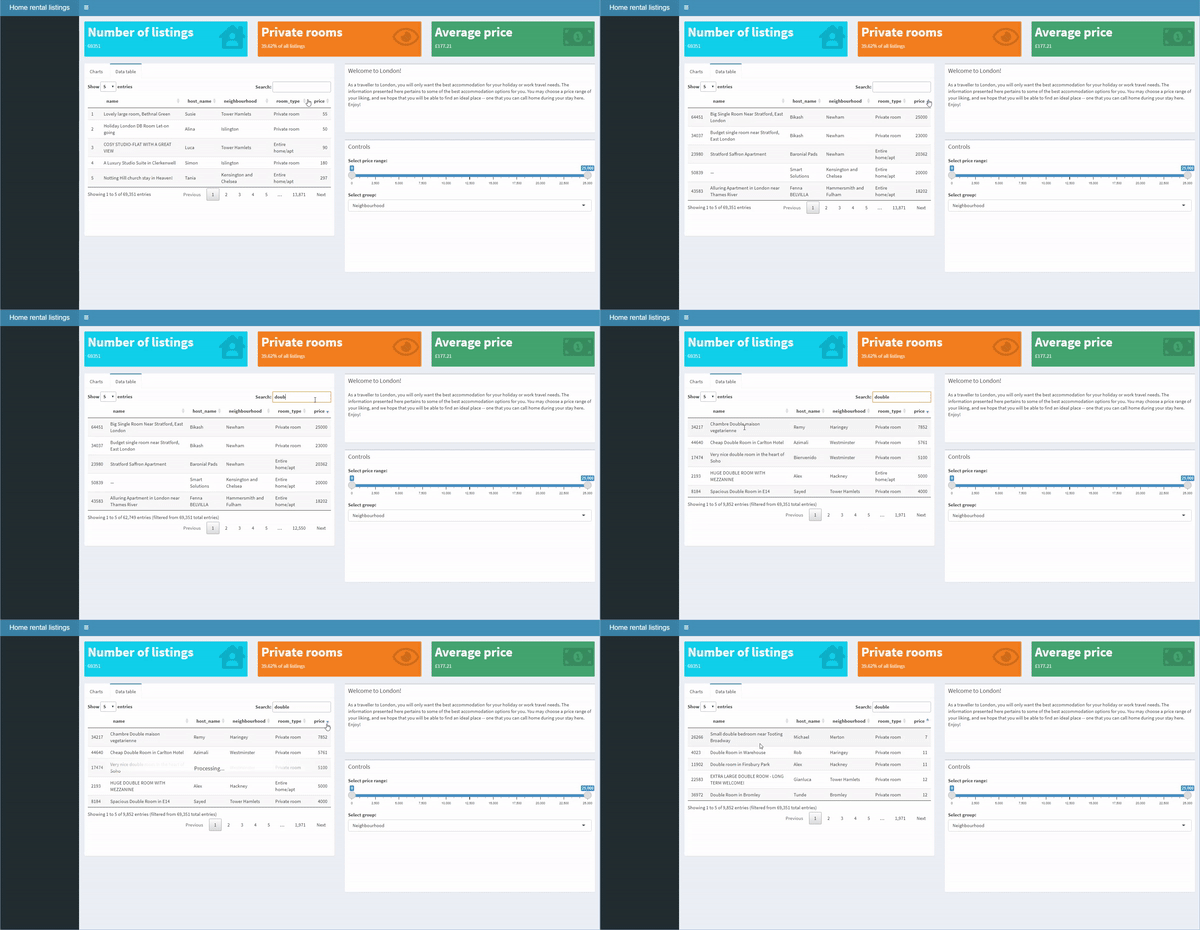
dataTableOutput("table")
server में:
output$table <-
renderDataTable(listings)

sidebar में:
sidebarMenu(
menuItem("Charts", ...),
menuItem("Map", ...))
body में:
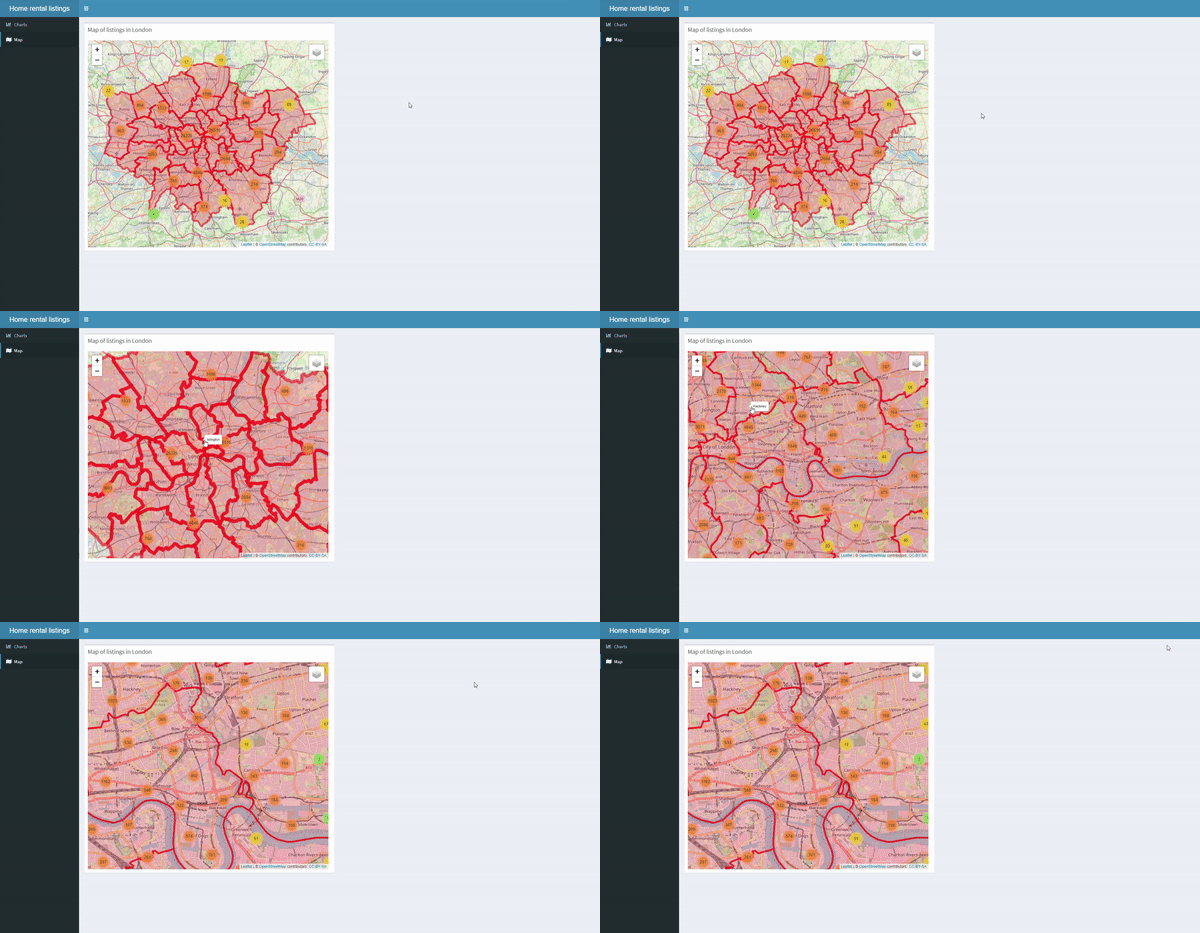
leafletOutput("map",...)
server में:
output$map <- renderLeaflet(map)
shinydashboard के साथ डैशबोर्ड बनाना