आउटपुट के प्रकार

shinydashboard के साथ डैशबोर्ड बनाना

Png Kee Seng

Researcher

Output और render फंक्शन

  • एक shinyApp में, आउटपुट होंगे
  • हर आउटपुट के लिए, फंक्शनों की एक जोड़ी कॉल करनी होती है

    • पहला UI में एक फंक्शन होता है
    • इससे आप तय करते हैं आउटपुट कहाँ दिखेगा
    • ऐसा आउटपुट फंक्शन आम तौर पर इस रूप में होता है:
      <type>output(<identifying label>, ...)
      
  • दूसरी कोड लाइन server फंक्शन के अंदर रहती है

    • यह इस रूप में होती है:
      output$<identifying label> <- render<type>(...)
      
shinydashboard के साथ डैशबोर्ड बनाना

उदाहरण: स्लीप स्टडी

  • पहले डेटा सेट इम्पोर्ट करें
    library(tidyverse)
    sleep <- read_csv("../data/Time Americans Spend Sleeping.csv")  
    
  • ये कॉलम हैं
    $ index                   : num [1:945] 0 1 2 3 4  ...
    $ Year                    : num [1:945] 2003 2004 2005 2006 2007 ...
    $ Period                  : chr [1:945] "Annual" "Annual" "Annual" "Annual" ...
    $ Avg hrs per day sleeping: num [1:945] 8.57 8.55 8.62 8.63  ...
    $ Standard Error          : num [1:945] 0.018 0.026 0.023 0.024  ...
    $ Type of Days            : chr [1:945] "All days" "All days" "All days" ...
    $ Age Group               : chr [1:945] "15 years and over" "15 years and over" ...
    $ Activity                : chr [1:945] "Sleeping" "Sleeping" "Sleeping" ...
    $ Sex                     : chr [1:945] "Both" "Both" "Both" ...
    
shinydashboard के साथ डैशबोर्ड बनाना

textOutput

  • पहले UI में textOutput रखें
ui <- fluidPage(
  titlePanel("Sleeping habits in America"), 
  textOutput("textlabel"))

server <- function(input, output) {
}

shinyApp(ui, server)
shinydashboard के साथ डैशबोर्ड बनाना

renderText

  • टेक्स्ट आउटपुट रेंडर करने के लिए, renderText को server में रखें
  • हमें output$ नोटेशन चाहिए होगा
ui <- fluidPage(
  titlePanel("Sleeping habits in America"), 
  textOutput("textlabel"))

server <- function(input, output) { output$textlabel <- renderText("Sleep deprivation is a serious health issue in many major cities around the world.") }
shinyApp(ui, server)
shinydashboard के साथ डैशबोर्ड बनाना

textOutput रेंडर हुआ

इनपुट इंटरैक्शन के बिना टेक्स्ट आउटपुट डेमो.

shinydashboard के साथ डैशबोर्ड बनाना

इंटरैक्शन के साथ textOutput

  • इनपुट और आउटपुट में इंटरैक्शन के लिए, इनपुट को input$ से कॉल करें
input$<type>
shinydashboard के साथ डैशबोर्ड बनाना

इंटरैक्शन के साथ textOutput

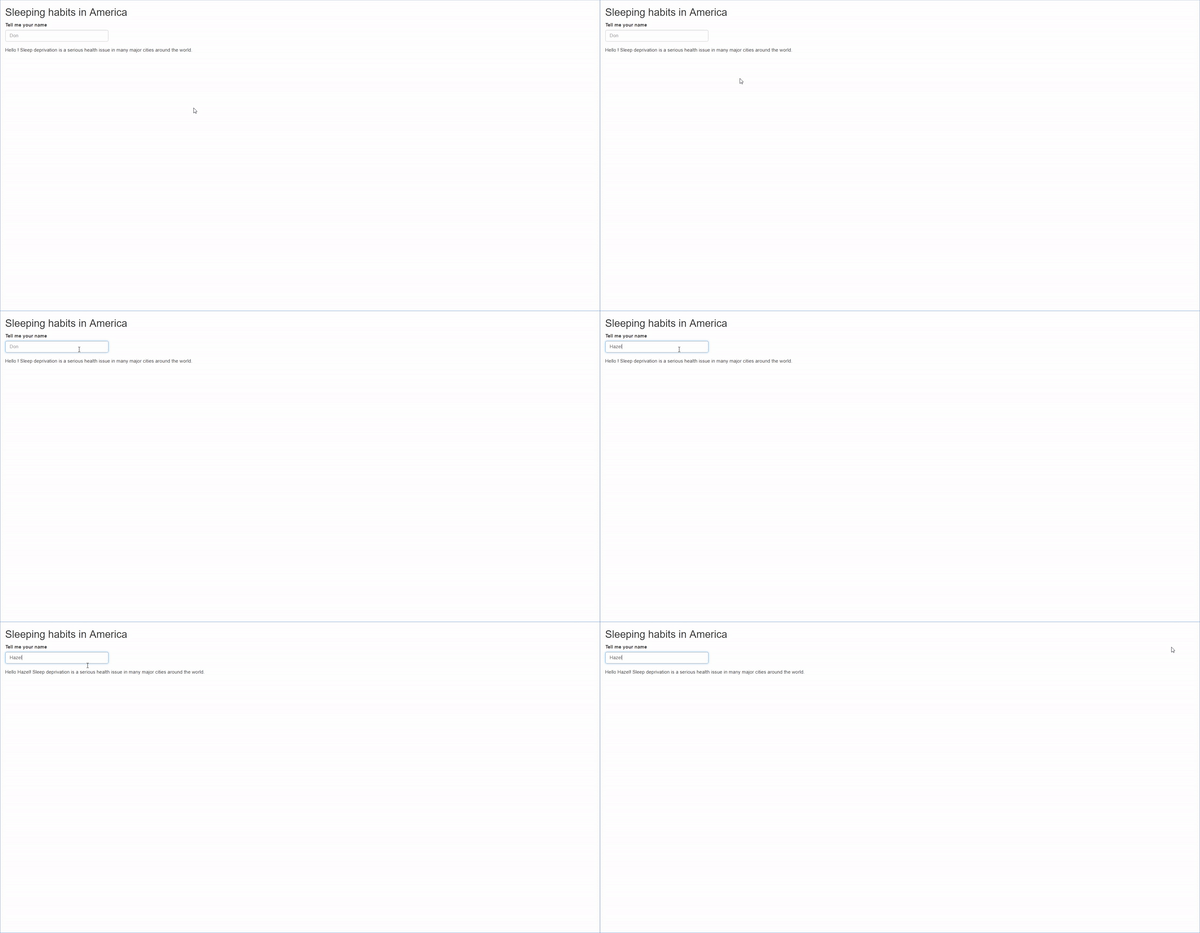
  • उदाहरण के तौर पर, एक टेक्स्ट इनपुट लें।
ui <- fluidPage(
  titlePanel("Sleeping habits in America"), 

textInput("textlabel", "Tell me your name", value = "", placeholder = "Don"),
textOutput("textoutlabel")) server <- function(input, output) { output$textoutlabel <- renderText(paste0("Hello ",
input$textlabel,
"Sleep deprivation is a serious health issue in many major cities around the world.")) } shinyApp(ui, server)
shinydashboard के साथ डैशबोर्ड बनाना

इंटरैक्शन के साथ textOutput

इंटरैक्शन के साथ टेक्स्ट आउटपुट.

shinydashboard के साथ डैशबोर्ड बनाना

plotOutput

  • UI में plotOutput() रखें
ui <- fluidPage(
  titlePanel("Sleeping habits in America"), 

plotOutput("plotlabel"))
server <- function(input, output) { } shinyApp(ui, server)
shinydashboard के साथ डैशबोर्ड बनाना

renderPlot

  • server() में renderPlot() रखें
ui <- fluidPage(
  titlePanel("Sleeping habits in America"), 
  plotOutput("plotlabel"))

server <- function(input, output) {

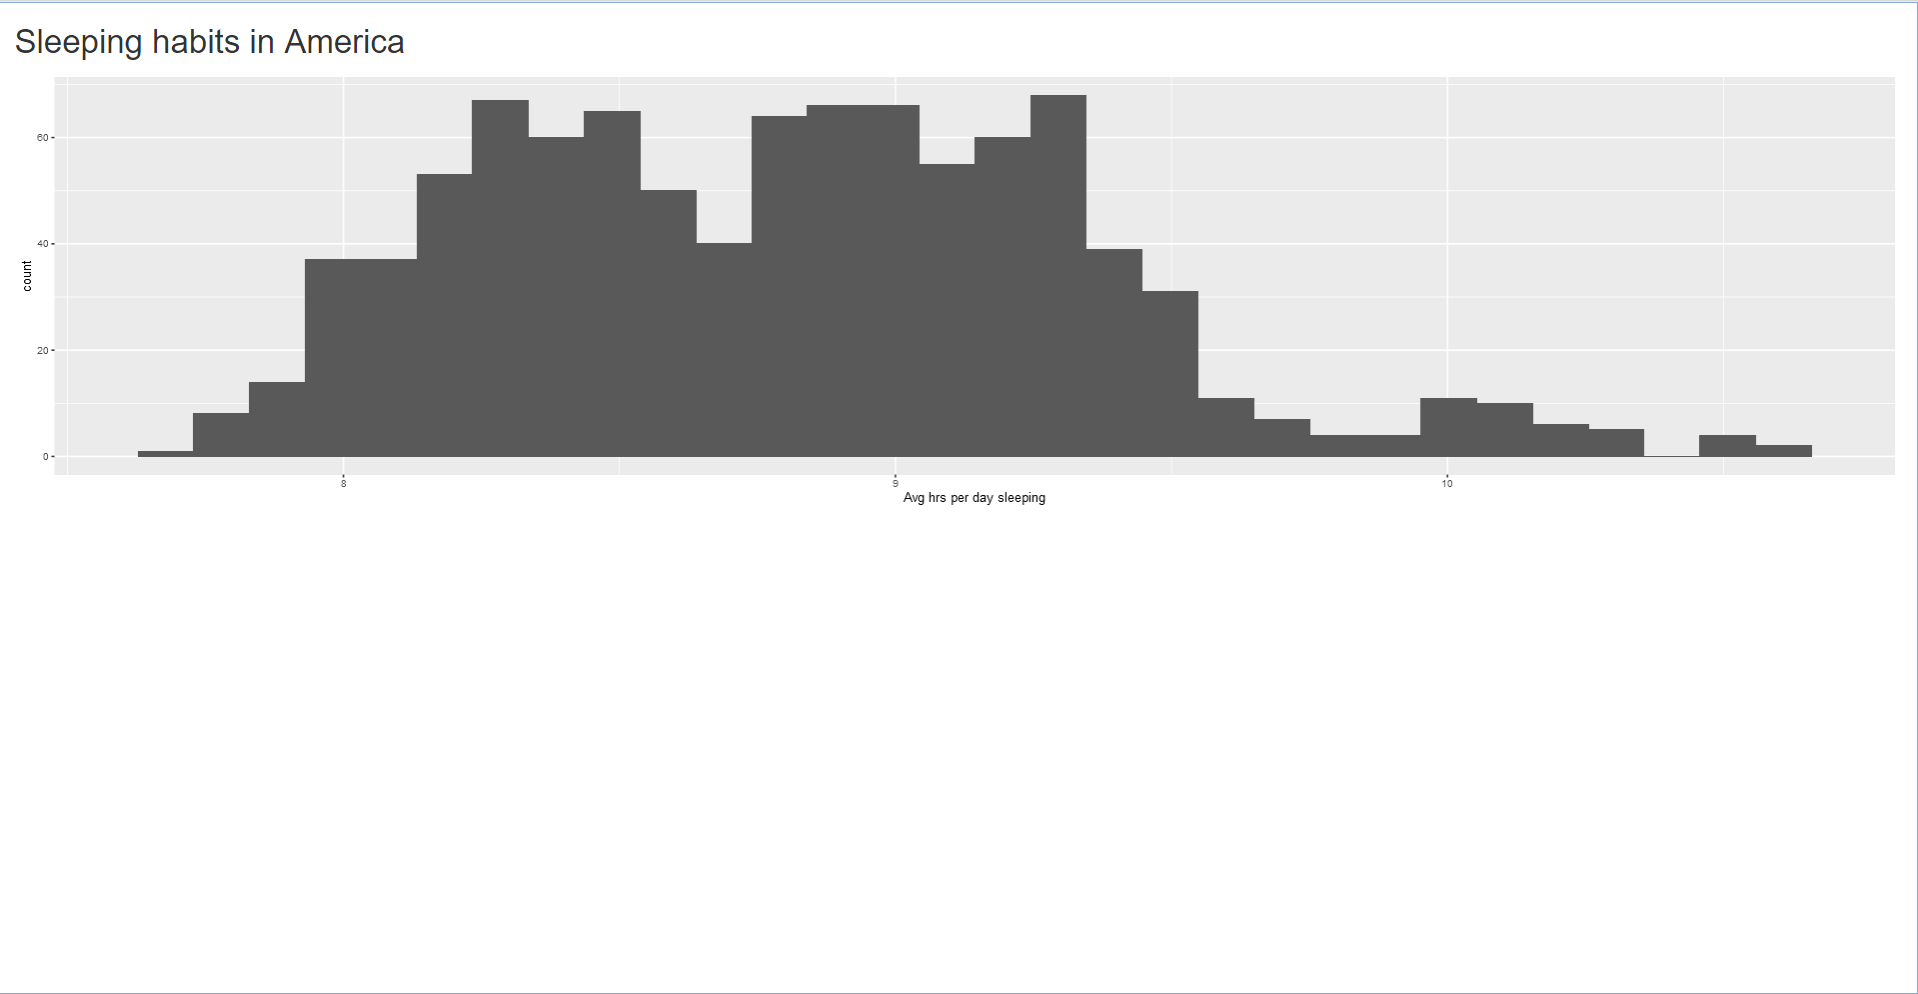
output$plotlabel <- renderPlot({ ggplot(sleep) + geom_histogram(aes(x = `Avg hrs per day sleeping`)) })
} shinyApp(ui, server)
shinydashboard के साथ डैशबोर्ड बनाना

plotOutput रेंडर हुआ

plotoutput डेमो.

shinydashboard के साथ डैशबोर्ड बनाना

selectInput के साथ plotOutput

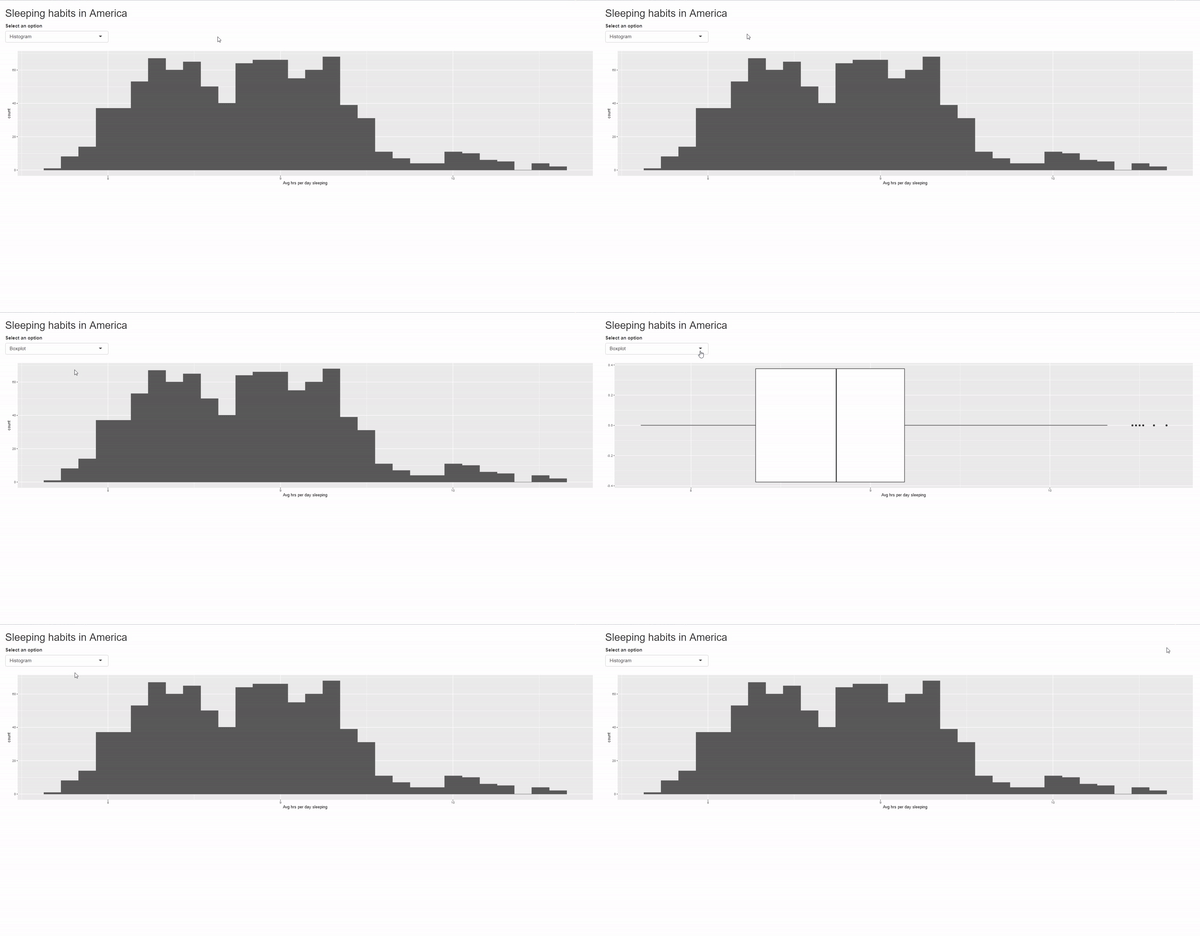
  • यूज़र इनपुट से अलग-अलग परिणाम बनाए जा सकते हैं
ui <- fluidPage(
  titlePanel("Sleeping habits in America"), 
  selectInput("selectlabel", 
              "Select an option",
              choices = c("Histogram", "Boxplot")),
  plotOutput("plotlabel"))
shinydashboard के साथ डैशबोर्ड बनाना

selectInput के साथ plotOutput

server <- function(input, output) {
  output$plotlabel <- renderPlot({
    if (input$selectlabel == "Histogram"){

ggplot(sleep) + geom_histogram(aes(x = `Avg hrs per day sleeping`))
} else if (input$selectlabel == "Boxplot"){
ggplot(sleep) + geom_boxplot(aes(x = `Avg hrs per day sleeping`))
} }) } shinyApp(ui, server)
shinydashboard के साथ डैशबोर्ड बनाना

selectInput के साथ plotOutput

selectInput के साथ plotOutput का डेमो

shinydashboard के साथ डैशबोर्ड बनाना

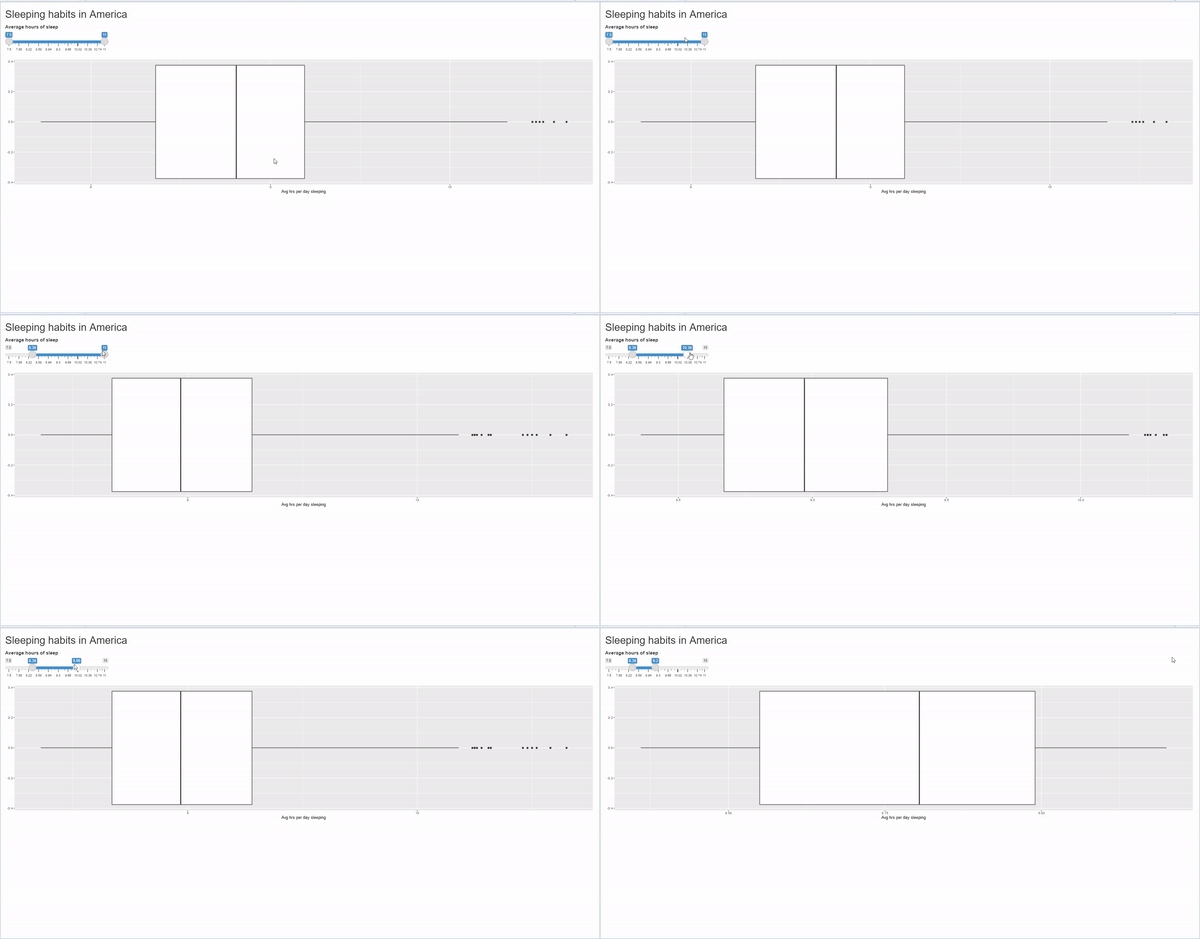
sliderInput के साथ plotOutput

  • अब sliderInput वाला उदाहरण देखें
ui <- fluidPage(
  titlePanel("Sleeping habits in America"), 

sliderInput("sliderlabel", "Average hours of sleep", min = 7.5, max = 11, value = c(7.5, 11), step = 0.02),
plotOutput("plotlabel")) server <- function(input, output) {
output$plotlabel <- renderPlot({ filter(sleep, `Avg hrs per day sleeping` >= input$sliderlabel[1], `Avg hrs per day sleeping` <= input$sliderlabel[2]) %>% ggplot() + geom_boxplot(aes(x=`Avg hrs per day sleeping`)) })
} shinyApp(ui, server)
shinydashboard के साथ डैशबोर्ड बनाना

sliderInput के साथ plotOutput

sliderInput के साथ plotOutput का डेमो
shinydashboard के साथ डैशबोर्ड बनाना

shiny में आइकन

  • shiny में ऐसे आइकन भी हैं जिन्हें shinyApp में इस्तेमाल कर सकते हैं
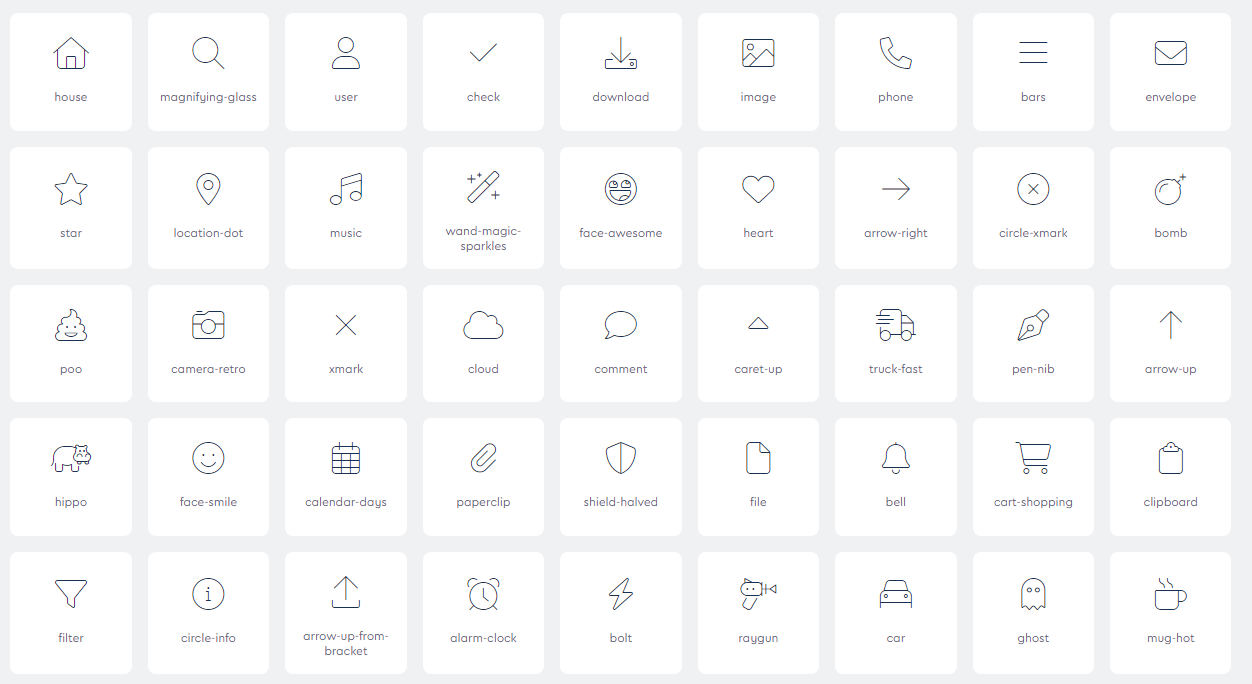
shiny में कुछ आइकन

1 https://fontawesome.com/icons
shinydashboard के साथ डैशबोर्ड बनाना

shiny में आइकन: एक उदाहरण

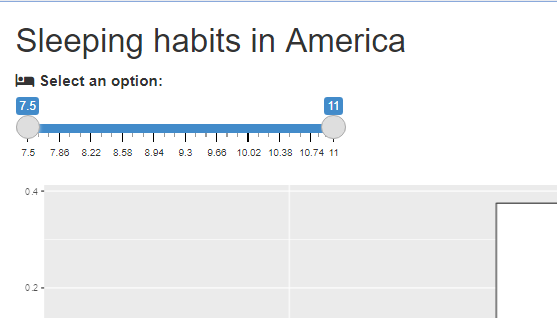
  • icon("...") का उपयोग करें
  • पहले का उदाहरण याद करें
  • जैसे, icon("bed")
ui <- fluidPage(
  titlePanel("Sleeping habits in America"), 
  sliderInput("sliderlabel",

list(icon("bed"),
"Select an option:"), min = 7.5, max = 11, value = c(7.5, 11), step = 0.02), plotOutput("plotlabel")) server <- function(input, output) { output$plotlabel <- renderPlot({ filter(sleep, `Avg hrs per day sleeping` >= input$sliderlabel[1], `Avg hrs per day sleeping` <= input$sliderlabel[2]) %>% ggplot() + geom_boxplot(aes(x=`Avg hrs per day sleeping`)) }) } shinyApp(ui, server)
shinydashboard के साथ डैशबोर्ड बनाना

आइकन वाला रेंडर किया ऐप

आइकन डेमो

shinydashboard के साथ डैशबोर्ड बनाना

अभ्यास करते हैं!

shinydashboard के साथ डैशबोर्ड बनाना

Preparing Video For Download...