MATLAB उपयोगकर्ताओं के लिए Python
Justin Kiggins
Product Manager
print(arr)
[[2, 4, 8, 16, 32]]
print(arr[2])
8
print(arr[0])
2
print(arr[-1])
32
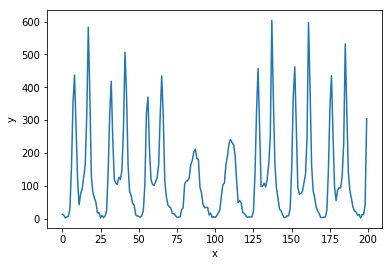
import matplotlib.pyplot as plt
# एक नया फ़िगर बनाएँ
plt.figure()

# x के फ़ंक्शन के रूप में y प्लॉट करें
plt.plot(x, y)

# x-label और y-label सेट करें
plt.xlabel('x')
plt.ylabel('y')

# प्लॉट दिखाना न भूलें!
plt.show()
# एक नया फ़िगर बनाएँ plt.figure()
# x के फ़ंक्शन के रूप में y प्लॉट करें plt.plot(x, y)
# x-label और y-label सेट करें plt.xlabel('x') plt.ylabel('y')
# प्लॉट दिखाना न भूलें! plt.show()