SAS उपयोगकर्ताओं के लिए R
Melinda Higgins, PhD
Research Professor/Senior Biostatistician Emory University

ggplot2 R के लिए एक शक्तिशाली ग्राफिक्स पैकेज हैggplot में "GG" का अर्थ "grammar of graphics" हैggplot2 ग्राफ बनाने के लिए लेयरिंग अप्रोच अपनाता है# Create plot for x=sex and y=diameter
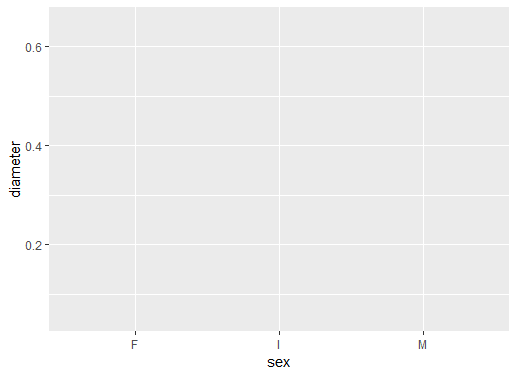
ggplot(data = abalone, aes(sex, diameter))
ggplot() से बेस लेयर परिभाषित करेंdata = abalone सेट करेंaes को sex और diameter पर सेट करें
अभी प्लॉट में कोई ग्राफिकल ऑब्जेक्ट नहीं है
sex के लिए तैयार हैdiameter के लिए तैयार है
# Add boxplot geometric object or geom
ggplot(data = abalone,
aes(sex, diameter)) +
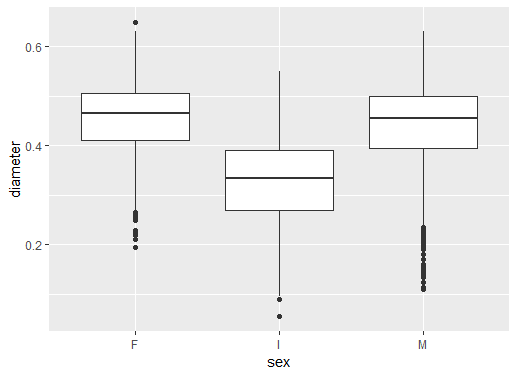
geom_boxplot()
+ लेयर जोड़ता हैबॉक्सप्लॉट geom_boxplot() जोड़ा गया
परिणाम बॉक्सप्लॉट्स की एक श्रृंखला है
F females, I infants, और M males
# Add black white theme
ggplot(data = abalone,
aes(sex, diameter)) +
geom_boxplot() +
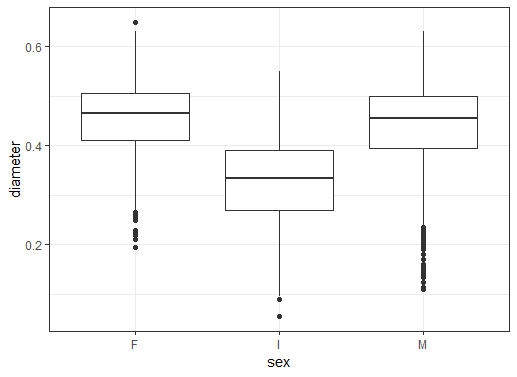
theme_bw()
theme_bw() से "theme" लेयर जोड़ें
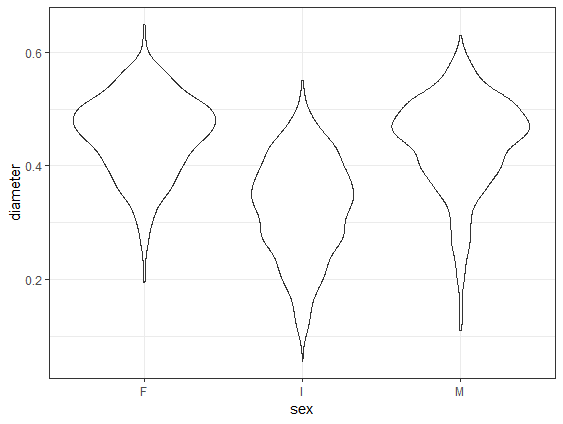
# Change to geom_violin()
ggplot(data = abalone,
aes(sex, diameter)) +
geom_violin() +
theme_bw()
geom_boxplot की जगह geom_violin उपयोग करें
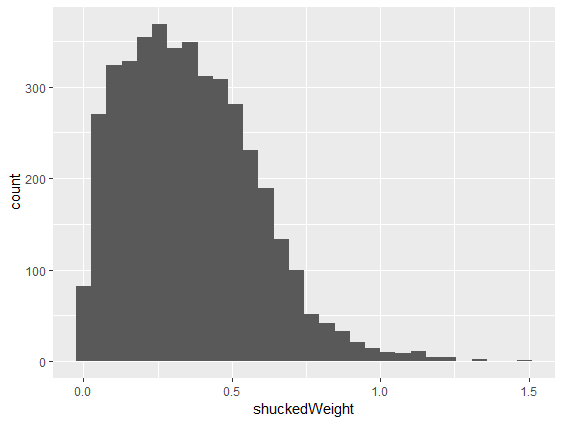
# Make histogram of shuckedWeight
ggplot(abalone, aes(shuckedWeight)) +
geom_histogram()
geom_histogram() जोड़ेंaes() को shuckedWeight पर सेट करें
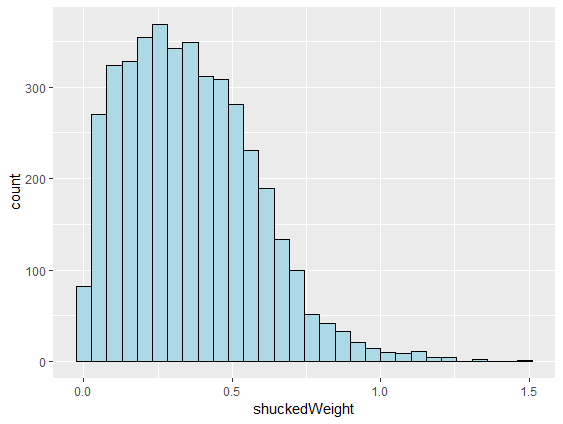
# Make lines black and fill light blue
ggplot(abalone, aes(shuckedWeight)) +
geom_histogram(color = "black",
fill = "lightblue")
color सेट करेंfill रंग सेट करें() के अंदर सेट होता है
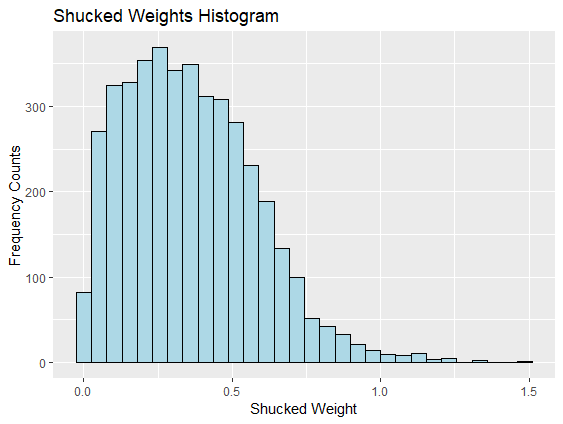
# Add x, y axis labels and title
ggplot(abalone, aes(shuckedWeight)) +
geom_histogram(color = "black",
fill = "lightblue") +
xlab("Shucked Weight") +
ylab("Frequency Counts") +
ggtitle("Shucked Weights Histogram")
xlab() और ylab() उपयोग करेंggtitle() उपयोग करें
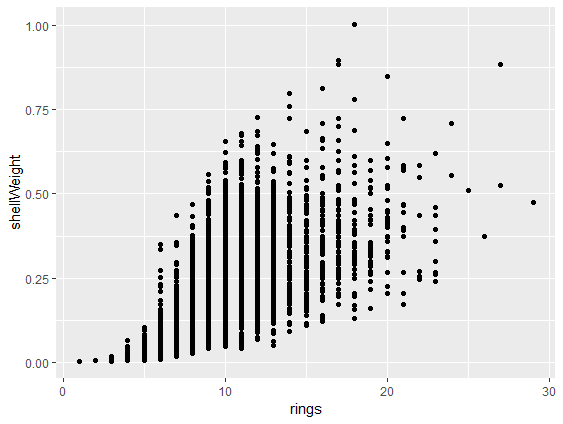
# Make scatterplot with geom_point()
ggplot(abalone,
aes(rings, shellWeight)) +
geom_point()
aes को दो वैरिएबल चाहिएgeom_point() पॉइंट्स जोड़ता है
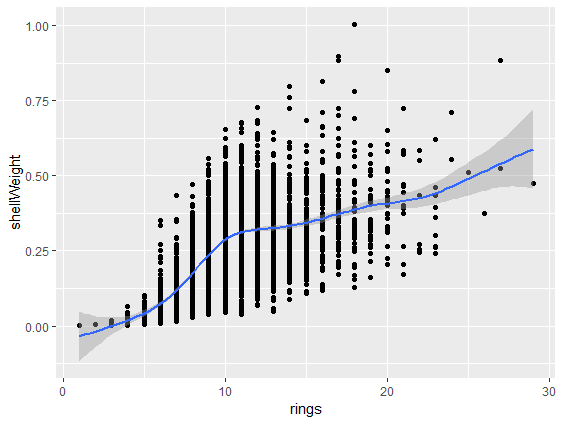
# Add smoothed fit line
ggplot(abalone,
aes(rings, shellWeight)) +
geom_point() +
geom_smooth()
geom_smooth() लाइन जोड़ें
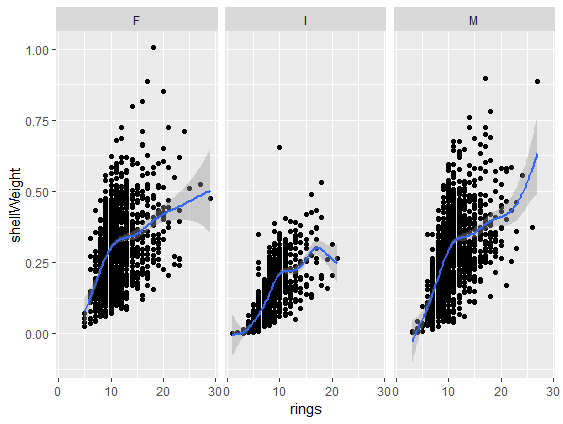
# Add panels using facet_wrap()
ggplot(abalone,
aes(rings, shellWeight)) +
geom_point() +
geom_smooth() +
facet_wrap(vars(sex))
facet_wrap() लेयर जोड़ेंvars(sex) पैनल के लिए वैरिएबल तय करता है
ggplot2 ग्राफिकल स्किल्स की नींवSAS उपयोगकर्ताओं के लिए R