वर्गीकृत डेटा: विश्लेषण और विज़ुअलाइज़ करें

SAS उपयोगकर्ताओं के लिए R

Melinda Higgins, PhD

Research Professor/Senior Biostatistician Emory University

श्रेणियाँ समेटें

# Use table() inside with() for bmicat
daviskeep %>% with(table(bmicat))
bmicat
1. underwt/norm       2. overwt        3. obese
            161              35               3

रिकोडेड वैरिएबल bmigt25 जोड़ें

# Add one more categorical variable bmigt25
daviskeep <- daviskeep %>%
  mutate(bmigt25 = ifelse(bmi > 25,
                          "2. overwt/obese",
                          "1. underwt/norm"))

# View frequencies for bmigt25 categories
daviskeep %>% with(table(bmigt25))
bmigt25
1. underwt/norm 2. overwt/obese
            161              38
SAS उपयोगकर्ताओं के लिए R

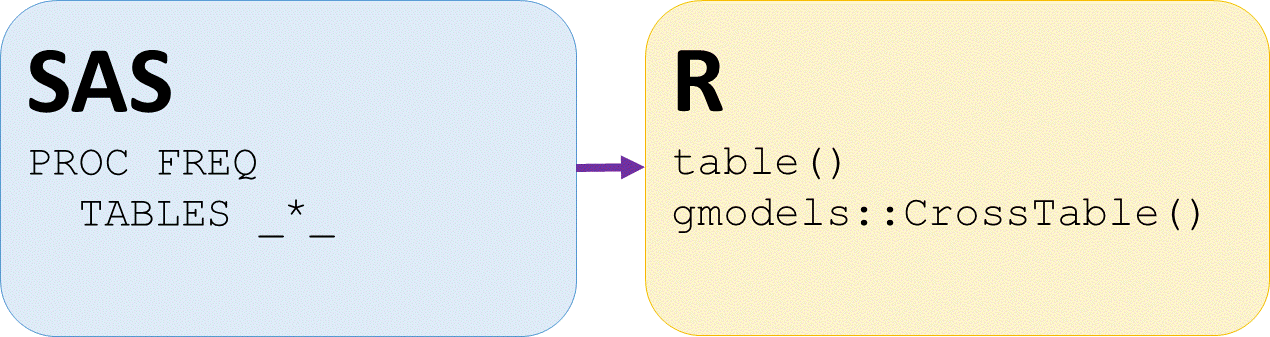
कॉन्टिन्जेन्सी टेबल: SAS और R

sas proc freq और r table फंक्शन तथा gmodels पैकेज का crosstable

SAS उपयोगकर्ताओं के लिए R

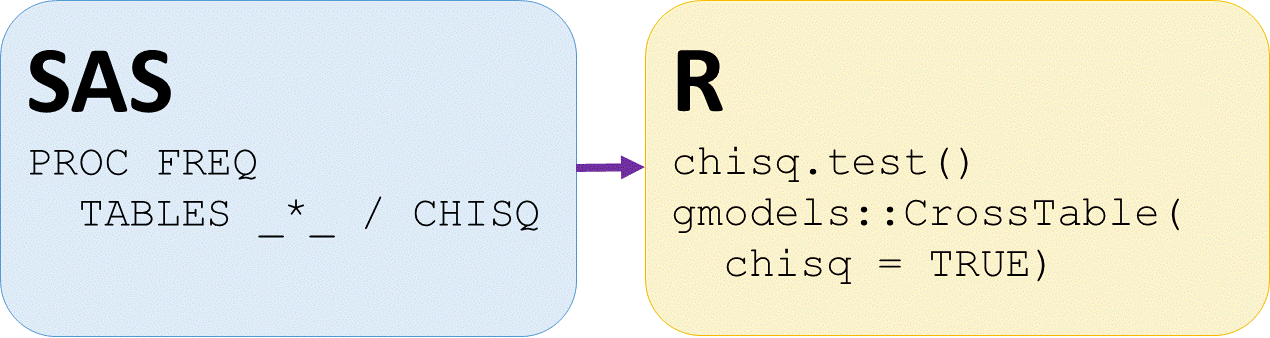
ची-स्क्वेयर टेस्ट: SAS और R

sas proc freq और r कोड: chisq.test और gmodels पैकेज crosstable विकल्प

SAS उपयोगकर्ताओं के लिए R

कॉन्टिन्जेन्सी टेबल और ची-स्क्वेयर टेस्ट

# Save table output of bmigt25 by sex
tablebmisex <- daviskeep %>%
  with(table(bmigt25, sex))
tablebmisex
# Use table object to run chisq.test
chisq.test(tablebmisex)
                 sex
bmigt25             F   M
  1. underwt/norm 107  54
  2. overwt/obese   4  34
Pearson's Chi-squared test with Yates'
continuity correction

data:  tablebmisex
X-squared = 36.759, df = 1, p-value = 1.336e-09
SAS उपयोगकर्ताओं के लिए R

gmodels पैकेज से ची-स्क्वेयर टेस्ट

# Load gmodel package
library(gmodels)
# Run gmodels::CrossTabs, show column %s and expected values
daviskeep %>%
  with(gmodels::CrossTable(bmigt25, sex,
                           chisq = TRUE,
                           prop.r = FALSE,
                           prop.t = FALSE,
                           prop.chisq = FALSE,
                           expected = TRUE))
SAS उपयोगकर्ताओं के लिए R

CrossTable आउटपुट - भाग 1

   Cell Contents
|-------------------------|
|                       N |
|              Expected N |
|           N / Col Total |
|-------------------------|

Total Observations in Table:  199
                | sex
        bmigt25 |         F |         M | Row Total |
----------------|-----------|-----------|-----------|
1. underwt/norm |       107 |        54 |       161 |
                |    89.804 |    71.196 |           |
                |     0.964 |     0.614 |           |
----------------|-----------|-----------|-----------|
2. overwt/obese |         4 |        34 |        38 |
                |    21.196 |    16.804 |           |
                |     0.036 |     0.386 |           |
----------------|-----------|-----------|-----------|
   Column Total |       111 |        88 |       199 |
                |     0.558 |     0.442 |           |
----------------|-----------|-----------|-----------|
SAS उपयोगकर्ताओं के लिए R

CrossTable आउटपुट - भाग 2

gmodels::CrossTable() आउटपुट - जारी...


Statistics for All Table Factors

Pearson's Chi-squared test
------------------------------------------------------------
Chi^2 =  38.99402     d.f. =  1     p =  4.251066e-10

Pearson's Chi-squared test with Yates' continuity correction
------------------------------------------------------------
Chi^2 =  36.75936     d.f. =  1     p =  1.336475e-09
SAS उपयोगकर्ताओं के लिए R

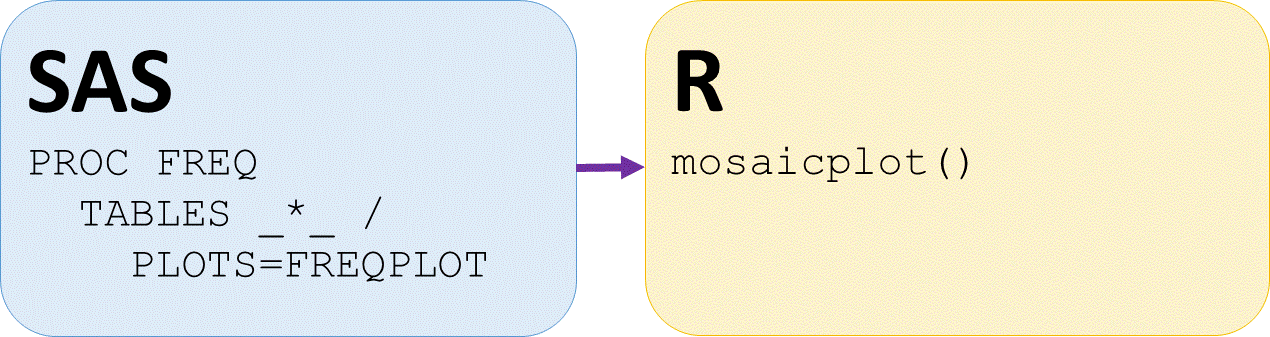
मोज़ेक प्लॉट: SAS और R

sas proc freq में tables स्टेटमेंट का freqplot विकल्प और r का mosaicplot फंक्शन

SAS उपयोगकर्ताओं के लिए R

दो-तरफ़ा श्रेणी अनुपातों का मोज़ेकप्लॉट
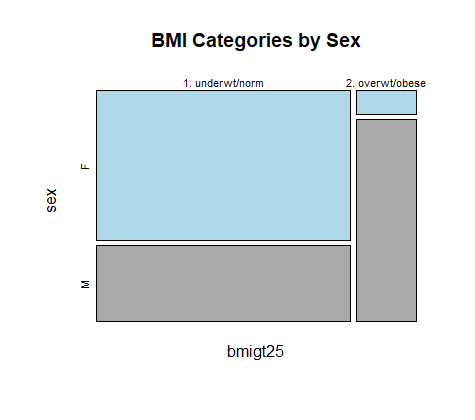
 

# Make mosaicplot of bmigt25 by sex
mosaicplot(bmigt25 ~ sex,
           data = daviskeep,
           color = c("light blue",
                     "dark grey"),
           main =
             "BMI Categories by Sex")

daviskeep डेटासेट में bmigt25 और sex का mosaicplot

SAS उपयोगकर्ताओं के लिए R

चलें, abalones के लिए श्रेणीगत संबद्धताएँ खोजते हैं!

SAS उपयोगकर्ताओं के लिए R

Preparing Video For Download...