RBF kernel को समझना

R में Support Vector Machines

Kailash Awati

Instructor

Quadratic kernel (default parameters)

  • डेटा को train/test में बाँटें (दिखाया नहीं गया)
  • degree 2 polynomial kernel इस्तेमाल करें (default params)
svm_model <- svm(y ~ ., data = trainset, 
                type = "C-classification", 
                kernel = "polynomial", 
                degree = 2)
svm_model
....
Number of Support Vectors:  204
# Predictions
pred_test <- predict(svm_model, testset)
mean(pred_test == testset$y)
0.8666667
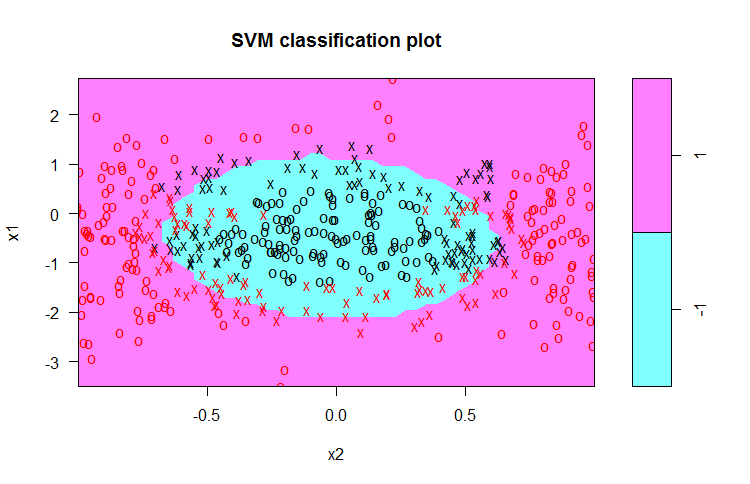
plot(svm_model, trainset)
R में Support Vector Machines

अध्याय 4.2 - complex dataset, default quadratic kernel, svm.plot से plot

R में Support Vector Machines

उच्च degree polynomial आज़माएँ

  • विषम degrees -3,5,9 आदि को हटा दें
  • degree 4 आज़माएँ
svm_model <- svm(y ~ ., data = trainset, 
                type = "C-classification", 
                kernel = "polynomial", 
                degree = 4)
svm_model
...
Number of Support Vectors: 203
# Predictions
pred_test <- predict(svm_model, testset)
mean(pred_test == testset$y)
0.8583333
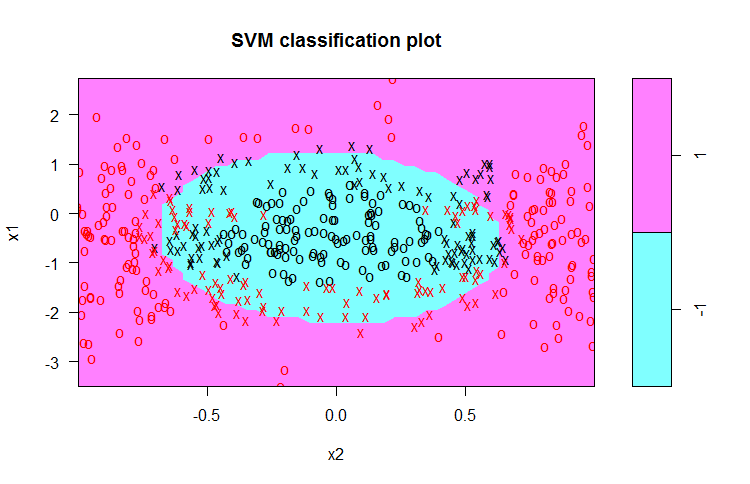
plot(svm_model, trainset)
R में Support Vector Machines

अध्याय 4.2 - complex dataset, default degree=4 kernel, svm.plot से plot

R में Support Vector Machines

एक और तरीका

  • Heuristic: जो पॉइंट पास हों उनकी classification समान हो:
    • K-Nearest Neighbors के समान.
  • डेटासेट के किसी पॉइंट के लिए, मान लें X1 = (a, b):
    • kernel का अधिकतम (a, b) पर होना चाहिए
    • (a, b) से दूर जाने पर मान घटना चाहिए
    • decay की दर सभी दिशाओं में समान होनी चाहिए
    • decay की दर tunable होनी चाहिए
  • इस गुण वाला एक सरल फंक्शन है exp(-gamma * r), जहाँ r दूरी है X1 और किसी भी अन्य पॉइंट X के बीच
R में Support Vector Machines

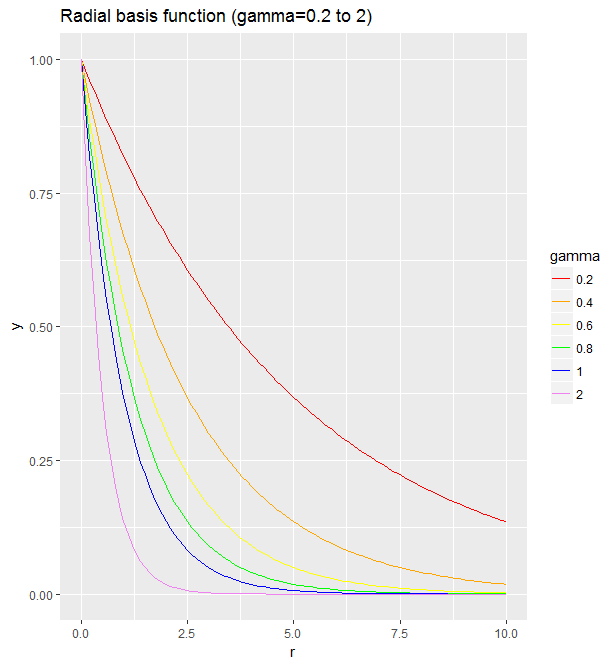
gamma के साथ RBF kernel कैसे बदलता है (code)

#rbf function
rbf <- function(r, gamma) exp(-gamma * r)

ggplot(data.frame(r = c(-0, 10)), aes(r)) + stat_function(fun = rbf, args = list(gamma = 0.2), aes(color = "0.2")) + stat_function(fun = rbf, args = list(gamma = 0.4), aes(color = "0.4")) + stat_function(fun = rbf, args = list(gamma = 0.6), aes(color = "0.6")) + stat_function(fun = rbf, args = list(gamma = 0.8), aes(color = "0.8")) + stat_function(fun = rbf, args = list(gamma = 1), aes(color = "1")) + stat_function(fun = rbf, args = list(gamma = 2), aes(color = "2")) + scale_color_manual("gamma", values = c("red","orange","yellow", "green","blue","violet")) + ggtitle("Radial basis function (gamma = 0.2 to 2)")
R में Support Vector Machines

image का विवरण

R में Support Vector Machines

Time to practice!

R में Support Vector Machines

Preparing Video For Download...