रेडियली सेपेरेबल डेटासेट तैयार करना

R में Support Vector Machines

Kailash Awati

Instructor

2D यूनिफॉर्मली डिस्ट्रीब्यूटेड पॉइंट्स जनरेट करें

  • 200 पॉइंट्स वाला डेटासेट जनरेट करें
    • 2 प्रेडिक्टर्स x1 और x2, -1 से 1 के बीच यूनिफॉर्म डिस्ट्रीब्यूटेड।
# Set required number of datapoints
n <- 200
# Set seed to ensure reproducibility
set.seed(42)

# Generate dataframe with 2 predictors x1 and x2 in (-1, 1)
df <- data.frame(x1 = runif(n, min = -1, max = 1),
                 x2 = runif(n, min = -1, max = 1))
R में Support Vector Machines

सर्कुलर बाउंडरी बनाएँ

  • 0.7 यूनिट रेडियस की सर्कुलर डिसीजन बाउंडरी बनाएँ।
  • कैटेगोरिकल वैरिएबल y, बाउंडरी के भीतर/बाहर होने पर -1 या +1 है।
radius <- 0.7
radius_squared <- radius ^ 2

#categorize data points depending on location wrt boundary
df$y <- factor(ifelse(df$x1 ^ 2 + df$x2 ^ 2 < radius_squared, -1, 1),
               levels = c(-1, 1))
R में Support Vector Machines

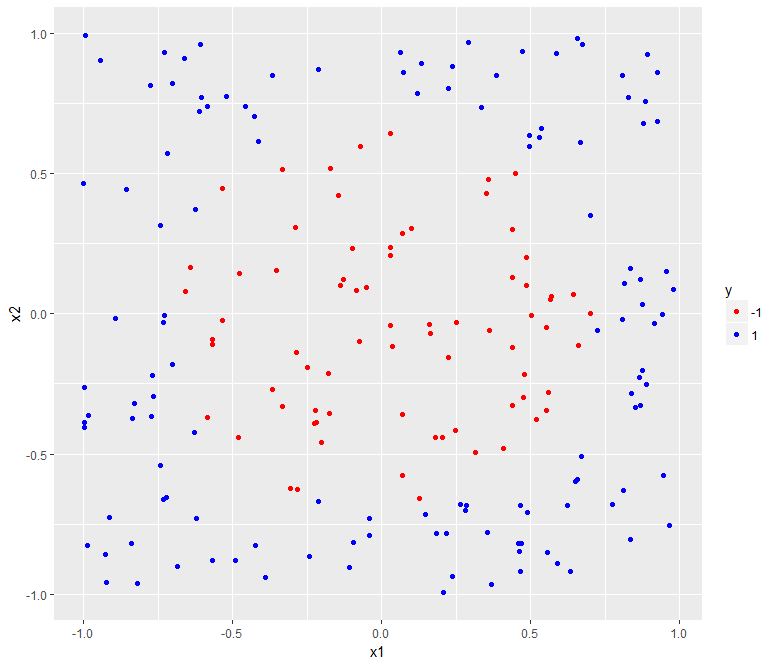
डेटासेट प्लॉट करें

  • ggplot से विज़ुअलाइज़ करें।
library(ggplot2)
  • प्रेडिक्टर्स 2 अक्षों पर; क्लास रंग से अलग होंगी।
# Build plot
p <- ggplot(data = df, aes(x = x1, y = x2, color = y)) + 
     geom_point() + 
     scale_color_manual(values = c("-1" = "red", "1" = "blue")) 
# Display plot 
p
R में Support Vector Machines

अध्याय 3.1 - रेडियली सेपेरेबल डेटासेट

R में Support Vector Machines

सर्कुलर बाउंडरी जोड़ना - भाग 1

  • हम सर्कल जनरेट करने के लिए एक फंक्शन बनाएँगे
# Function generates dataframe with points
# lying on a circle of radius r
circle <- 
  function(x1_center, x2_center, r, npoint = 100) {

  # Angular spacing of 2*pi/npoint between points
  theta <- seq(0, 2 * pi, length.out = npoint)
  x1_circ <- x1_center + r * cos(theta)
  x2_circ <- x2_center + r * sin(theta)

  data.frame(x1c = x1_circ, x2c = x2_circ)
}
R में Support Vector Machines

सर्कुलर बाउंडरी जोड़ना - भाग 2

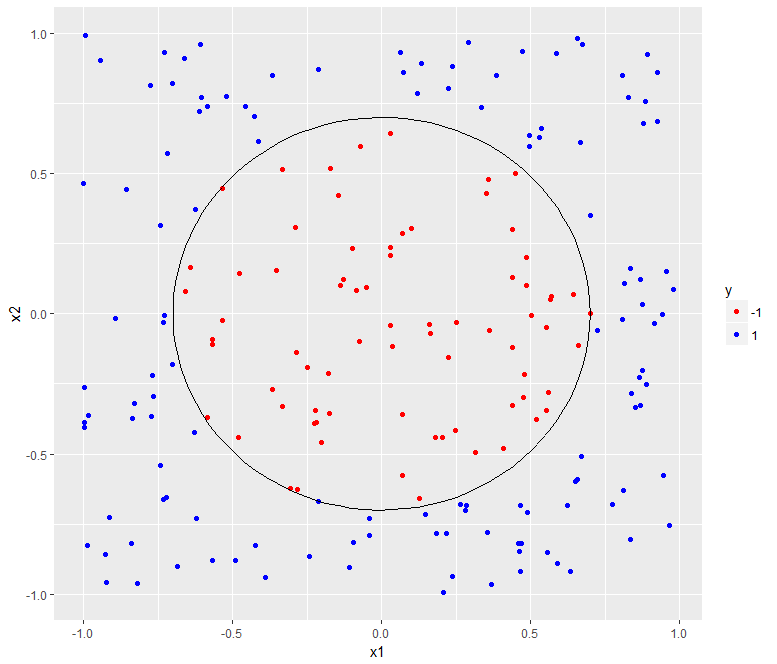
  • प्लॉट में बाउंडरी जोड़ने के लिए:
    • circle() फंक्शन से बाउंडरी जनरेट करें।
    • geom_path() से बाउंडरी प्लॉट में जोड़ें।
# Generate boundary
boundary <- circle(x1_center = 0,
                   x2_center = 0,
                   r = radius)
# Add boundary to previous plot
p <- p + 
     geom_path(data = boundary,
               aes(x = x1c, y = x2c),
               inherit.aes = FALSE)
# Display plot
p
R में Support Vector Machines

अध्याय 3.1 - डिसीजन बाउंडरी सहित रेडियली सेपेरेबल डेटासेट

R में Support Vector Machines

अभ्यास करते हैं!

R में Support Vector Machines

Preparing Video For Download...