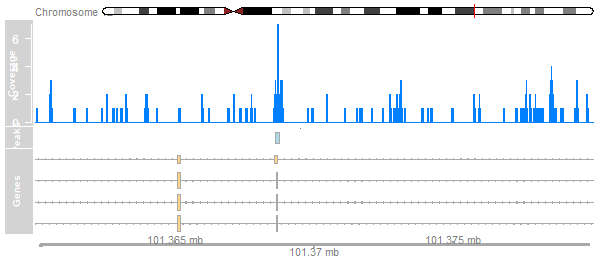
Peaks को और नज़दीक से देखें
R में Bioconductor के साथ ChIP-seq

Peter Humburg
Statistician, Macquarie University
Gviz का उपयोग
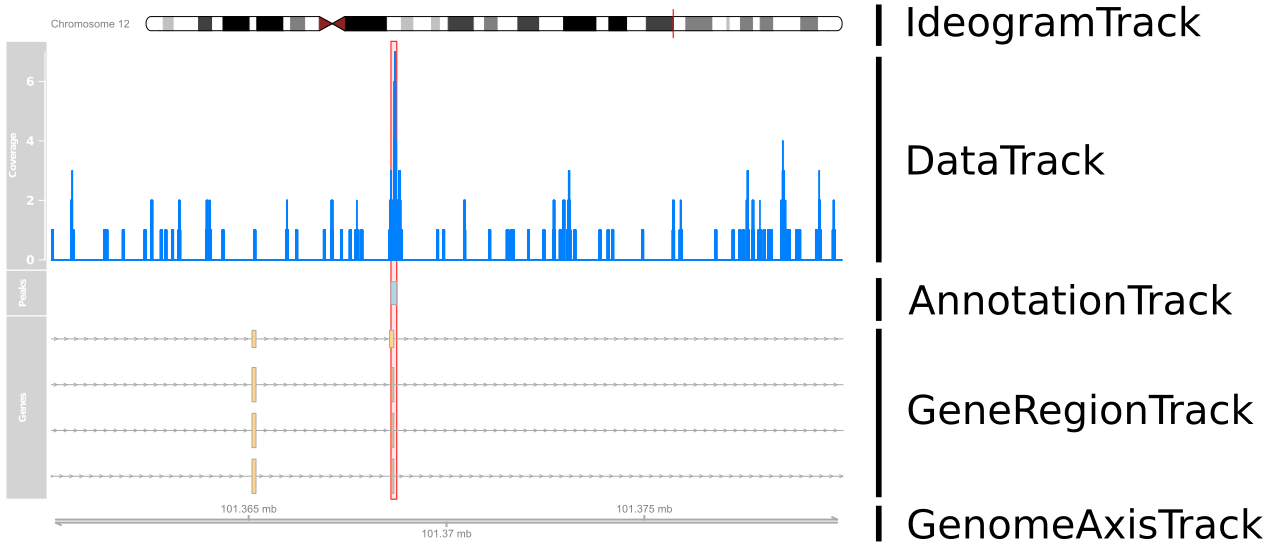
हम क्या plot कर रहे हैं?
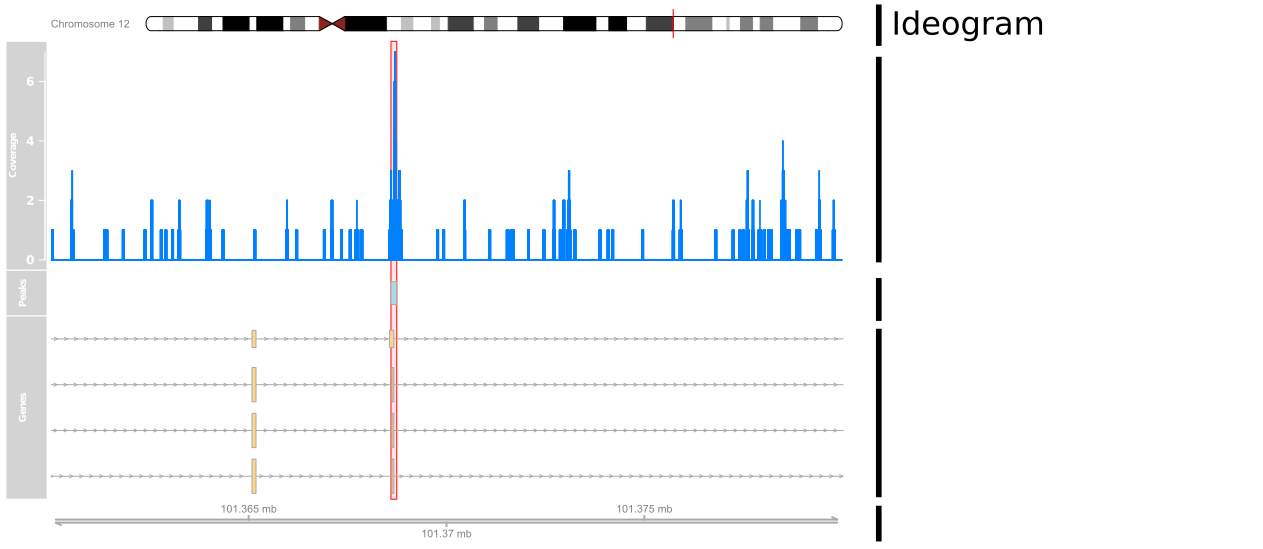
हम क्या plot कर रहे हैं?
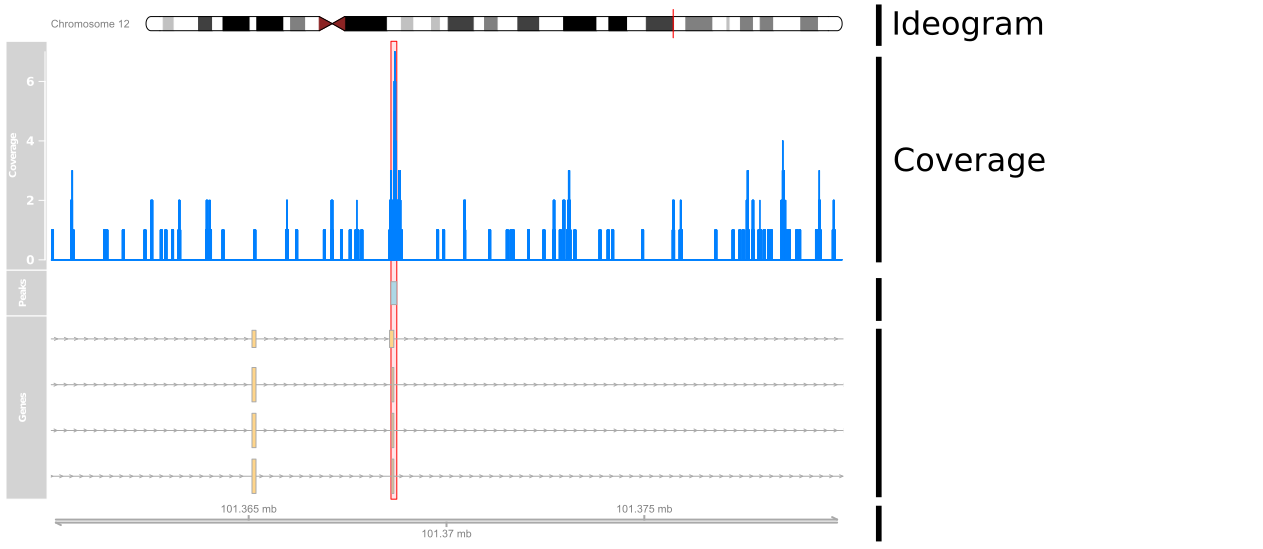
हम क्या plot कर रहे हैं?
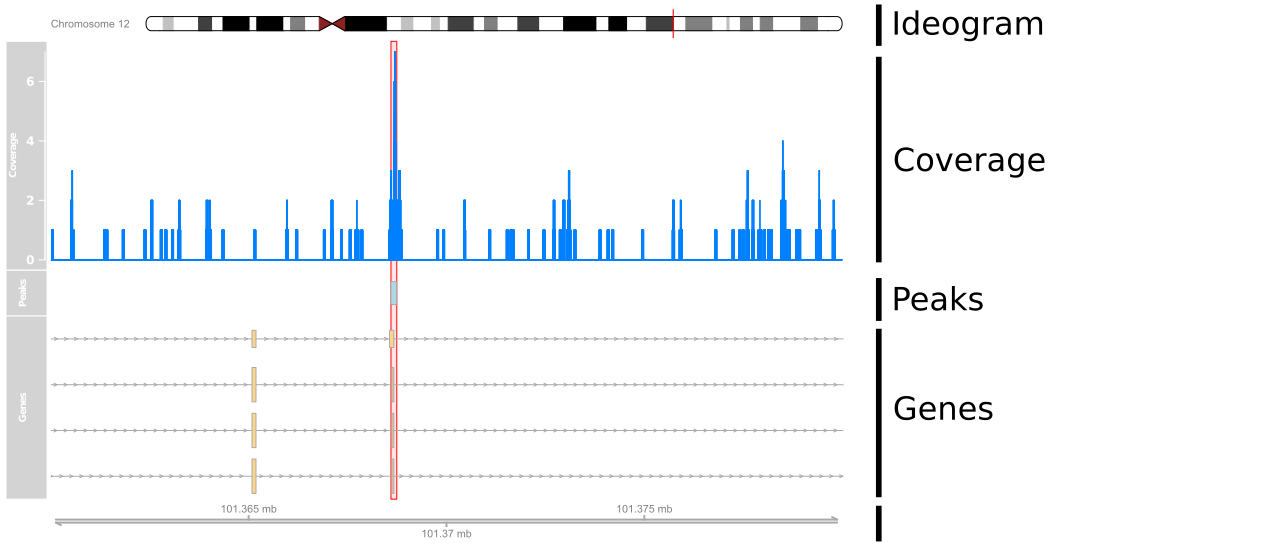
हम क्या plot कर रहे हैं?
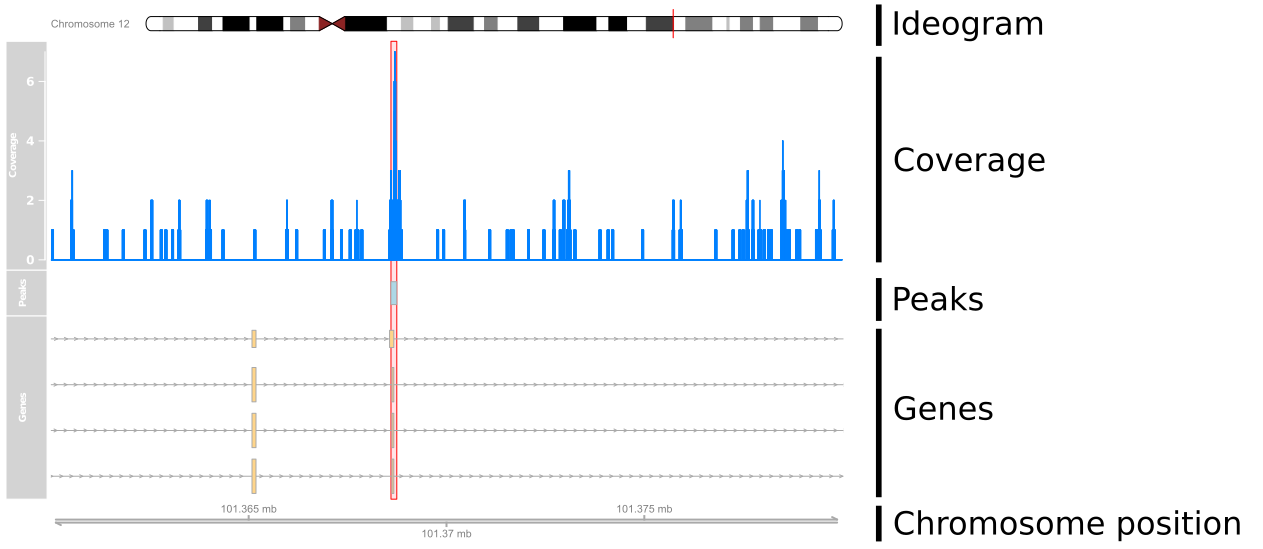
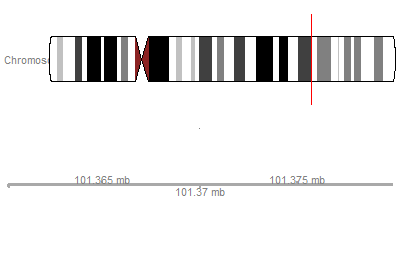
Coordinates सेट करना
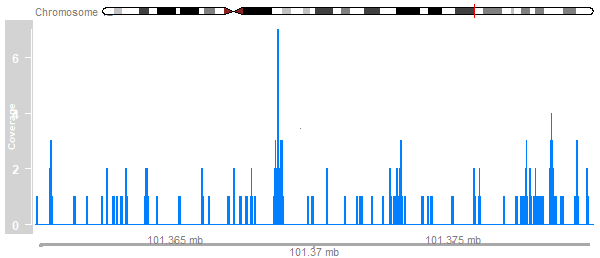
Data जोड़ना
cover_track <- DataTrack(cover_ranges,window=100000,type='h',name="Coverage")
plotTracks(list(ideogram, cover_track, axis), from=101360000, to=101380000)
Annotations जोड़ना
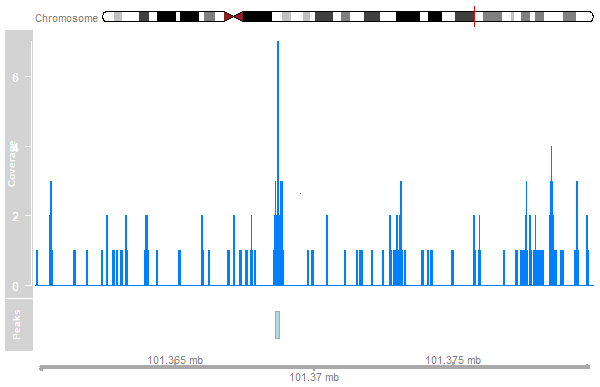
peak_track <- AnnotationTrack(peaks, name="Peaks")
plotTracks(list(ideogram, cover_track, peak_track, axis),
           from=101360000, to=101380000)
Gene Annotations
library(TxDb.Hsapiens.UCSC.hg19.knownGene)tx <- GeneRegionTrack(TxDb.Hsapiens.UCSC.hg19.knownGene, chromosome="chr12", start=101360000, end=101380000, name="Genes") plotTracks(list(ideogram, cover_track, peak_track, tx, axis), from=101360000, to=101380000)