ज़ूम इन और ज़ूम आउट: ग्राफ का समग्र सारांश

इंटरमीडिएट Network Analysis in Python

Eric Ma

Data Carpentry instructor and author of nxviz package

विभिन्न स्तरों पर ग्राफ अन्वेषण

  • वैश्विक और स्थानीय स्तर पर अन्वेषण

  • Global: Centrality distributions

  • Local: Connectivity and structures

इंटरमीडिएट Network Analysis in Python

नोड्स पर ज़ूम इन

  • दिए गए नोड या नोड्स के सेट को अलग करें

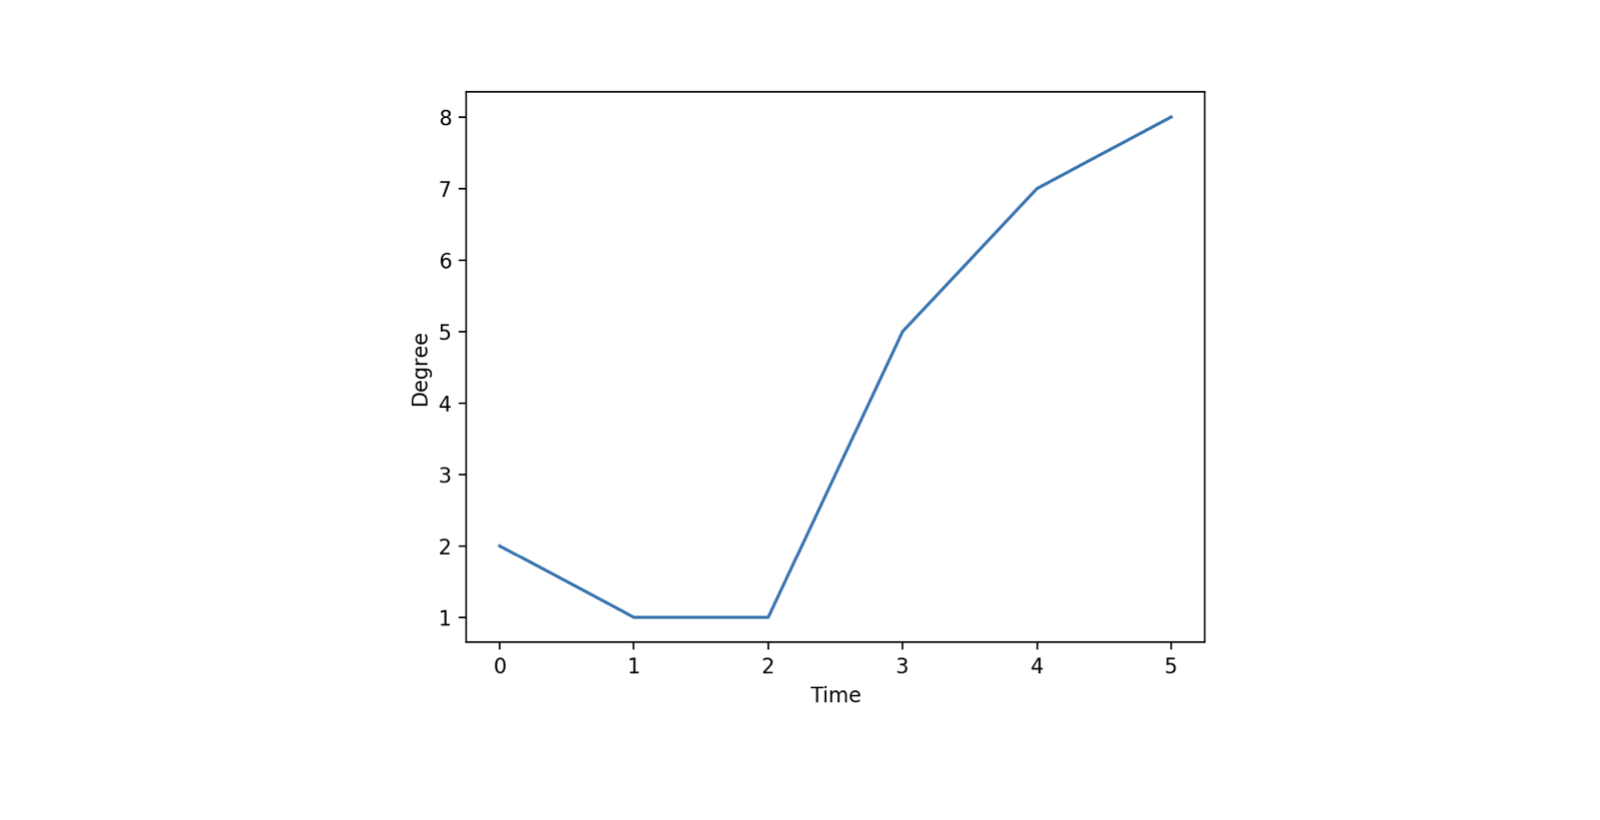
  • समय के साथ नोड आँकड़ा प्लॉट करें

इंटरमीडिएट Network Analysis in Python

बदलते नोड आँकड़ों का सारांश

  • कस्टमर-प्रोडक्ट डेटासेट
    • जाँचें कि समय के साथ परचेज़िंग पैटर्न कैसे बदले हैं
  • customer1 - रुचि का नोड
इंटरमीडिएट Network Analysis in Python

बदलते नोड आँकड़ों का सारांश

Gs = [....] 

noi = 'customer1'
degs = []
for g in Gs: ... # Get the degree of the node degs.append(len(g.neighbors(noi)))
plt.plot(degs) plt.show()
इंटरमीडिएट Network Analysis in Python

बदलते नोड आँकड़ों का सारांश

ch3-3.020.png

इंटरमीडिएट Network Analysis in Python

Default dictionaries

from collections import defaultdict
d = defaultdict(list)

d['heathrow'].append(0.31) d['heathrow'].append(0.84)
d
defaultdict(list, {'heathrow': [0.31, 0.84]})
इंटरमीडिएट Network Analysis in Python

Default dictionaries

d2 = dict()
d2['heathrow'].append(0.31)
KeyError                           Traceback (most recent call last)
<ipython-input-19-291c74368a8f> in <module>()
--> 1 d2['heathrow'].append(0.31)
KeyError: 'heathrow'
इंटरमीडिएट Network Analysis in Python

अभ्यास करते हैं!

इंटरमीडिएट Network Analysis in Python

Preparing Video For Download...