GAM इंटरेक्शन का प्लॉट करना
R में Generalized Additive Models (GAMs) के साथ नॉनलाइनियर मॉडलिंग

Noam Ross
Senior Research Scientist, EcoHealth Alliance
mgcv के plot() से इंटरेक्शन प्लॉट करना.
plot(mod_2d)
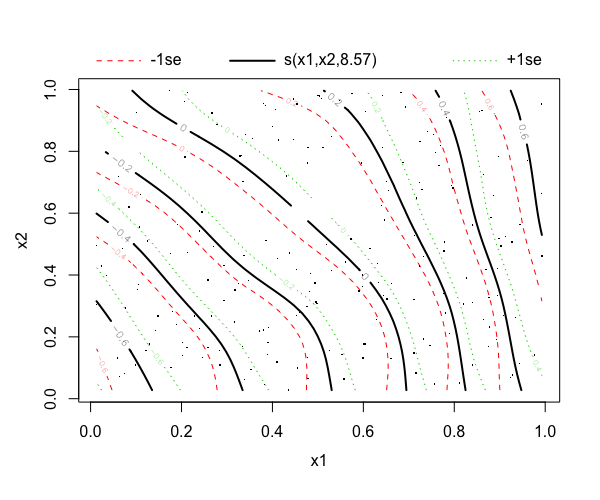
इंटरेक्शन के साथ mgcv का plot() उपयोग करना
plot(mod_2d, scheme = 1)
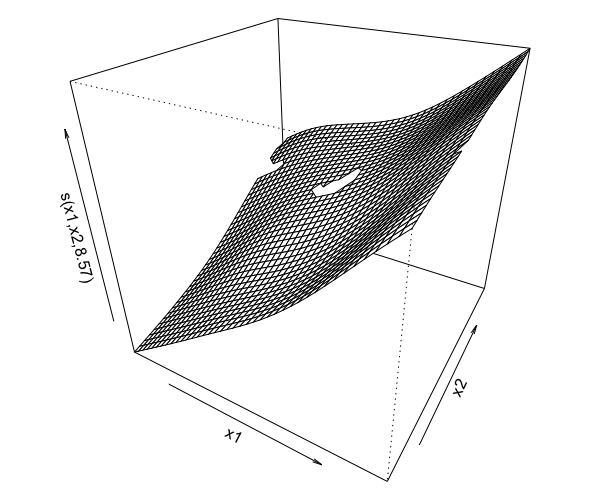
इंटरेक्शन के साथ mgcv का plot() उपयोग करना
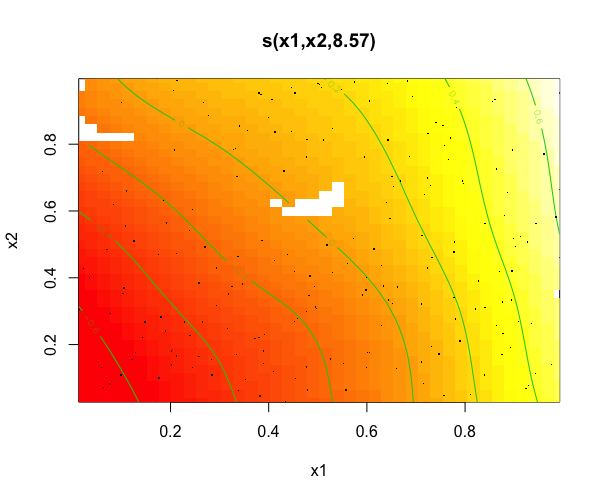
plot(mod_2d, scheme = 2)
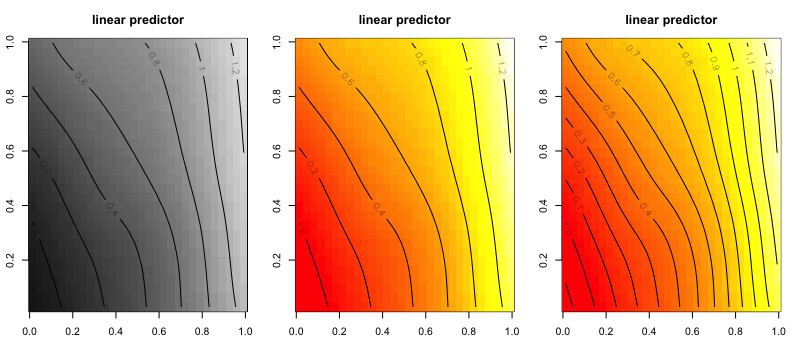
vis.gam() से इंटरेक्शन प्लॉट कस्टमाइज़ करना
vis.gam(x = mod,                # GAM object
        view = c("x1", "x2"),   # variables
        plot.type = "persp")    # kind of plot
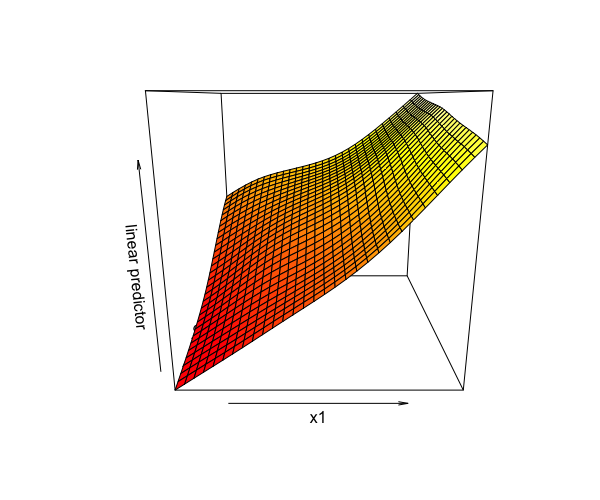
vis.gam() से इंटरेक्शन प्लॉट कस्टमाइज़ करना (2)
vis.gam(x = mod,                # GAM object
        view = c("x1", "x2"),   # variables
        plot.type = "contour")  # kind of plot
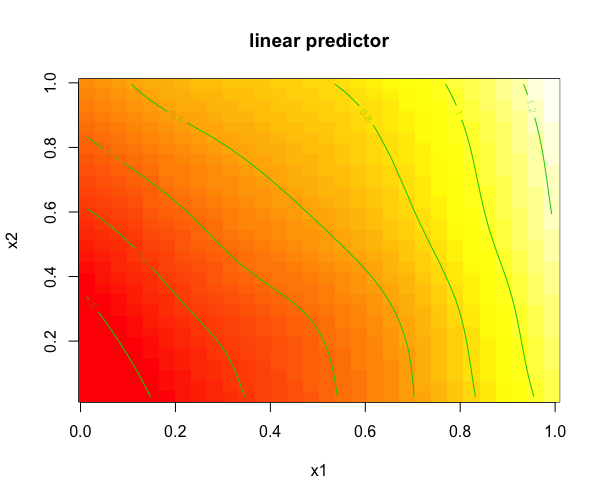
vis.gam() से इंटरेक्शन प्लॉट कस्टमाइज़ करना
vis.gam(mod, view = c("x1", "x2"), plot.type = "contour", too.far = 0.1)
vis.gam(mod, view = c("x1", "x2"), plot.type = "contour", too.far = 0.05)
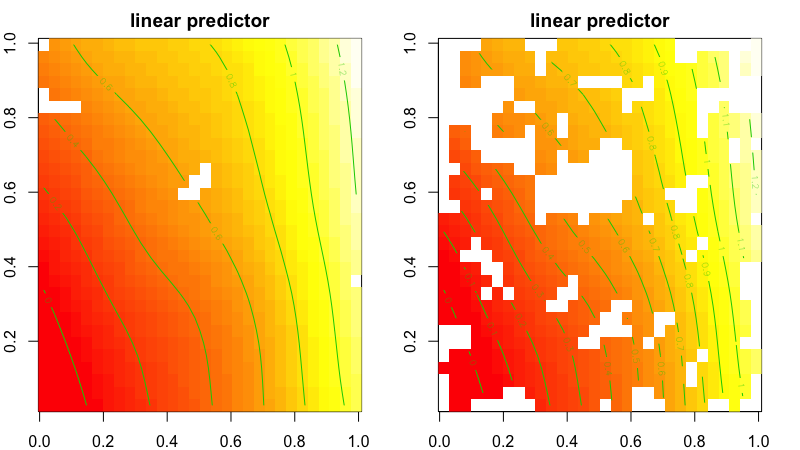
Perspective प्लॉट के विकल्प
vis.gam(x = mod, view = c("x1", "x2"),
        plot.type = "persp", se = 2)
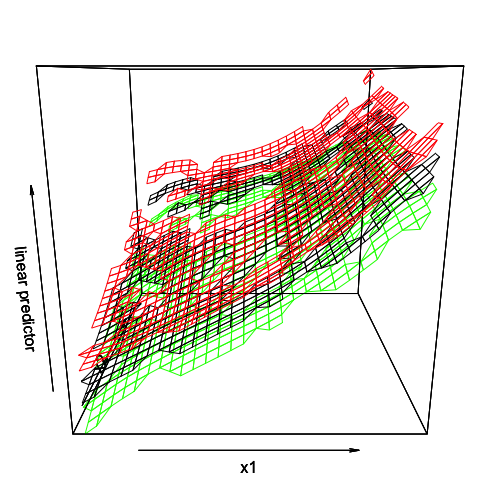
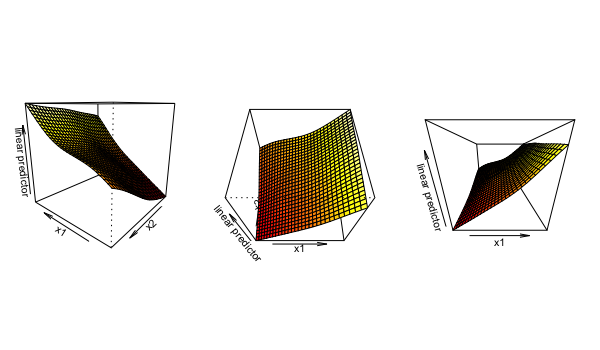
Perspective प्लॉट के विकल्प
vis.gam(g, view = c("x1", "x2"), plot.type = "persp",
                                 theta = 220)
vis.gam(g, view = c("x1", "x2"), plot.type = "persp",
                                 phi = 55)
vis.gam(g, view = c("x1", "x2"), plot.type = "persp",
                                 r = 0.1)
Contour प्लॉट के विकल्प
vis.gam(g, view = c("x1", "x2"), plot.type = "contour",
                                 color = "gray")
vis.gam(g, view = c("x1", "x2"), plot.type = "contour",
                                 contour.col = "blue")
vis.gam(g, view = c("x1", "x2"), plot.type = "contour",
                                 nlevels = 20)