Geopandas के साथ बेसिक मैपिंग

Python में US Census डेटा का विश्लेषण

Lee Hachadoorian

Asst. Professor of Instruction, Temple University

Geospatial डेटा - आगे की लर्निंग

Python में US Census डेटा का विश्लेषण

Geospatial डेटा लोड करना

import geopandas as gpd

# Load a geospatial file geo_state = gpd.read_file("state_computer_use.gpkg")
type(geo_state)
geopandas.geodataframe.GeoDataFrame
Python में US Census डेटा का विश्लेषण

Geopandas DataFrames

print(geo_state.columns)
Index(['state', 'postal', 'name', 'geometry', 'total', 'has_computer',
       'desktop_laptop', 'desktop_laptop_only', 'portable_device',
       'portable_device_only', 'no_computer'],
      dtype='object')
Python में US Census डेटा का विश्लेषण

Geopandas DataFrames

print(geo_state.head())
  state postal  ... portable_device_only no_computer
0    06     CA  ...              1052406     1263635
1    08     CO  ...               148749      168639
2    11     DC  ...                23554       32916
3    16     ID  ...                46565       67454
4    17     IL  ...               415840      640062

[5 rows x 11 columns]
Python में US Census डेटा का विश्लेषण

Geopandas की geometry कॉलम

print(geo_state["geometry"].head())
0    (POLYGON ((-1716661.572795197 -1091585.2669098...
1    (POLYGON ((-787764.8711845676 -679501.90042785...
2    (POLYGON ((1950824.825659711 -402441.066172522...
3    (POLYGON ((-1357254.591159301 77405.1771214068...
4    (POLYGON ((720437.1241238854 -496471.759394428...
Name: geometry, dtype: object
Python में US Census डेटा का विश्लेषण

Geopandas प्लॉटिंग

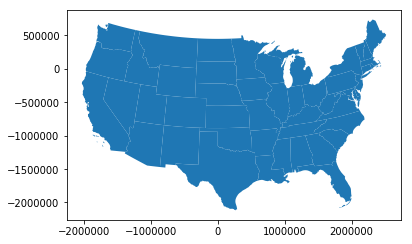
geo_state.plot()

महाद्वीपीय संयुक्त राज्य अमेरिका का मानचित्र.

Python में US Census डेटा का विश्लेषण

कोरोप्लेस्थ मैप्स

geo_state.plot(column = "has_computer")
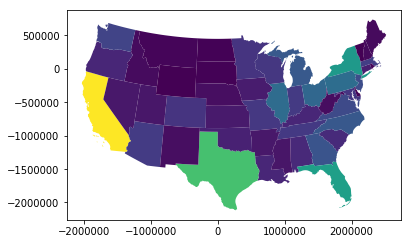
महाद्वीपीय संयुक्त राज्य अमेरिका का मानचित्र, जहाँ राज्यों को कंप्यूटर वाले घरों की संख्या के अनुसार रंगा गया है.

Python में US Census डेटा का विश्लेषण

कोरोप्लेस्थ मैप्स

geo_state.plot(column = "has_computer", cmap = "YlOrRd")
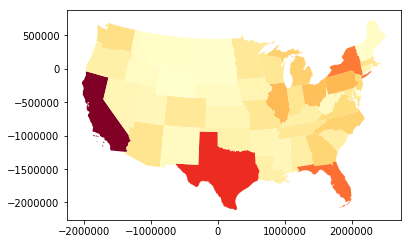
महाद्वीपीय संयुक्त राज्य अमेरिका का मानचित्र, जहाँ राज्यों को कंप्यूटर वाले घरों की संख्या के अनुसार रंगा गया है.

Python में US Census डेटा का विश्लेषण

कोरोप्लेस्थ मैप्स

geo_state["pct_has_computer"] = 100 * geo_state["has_computer"]/geo_state["total"]

geo_state.plot(column = "pct_has_computer", cmap = "YlOrRd")
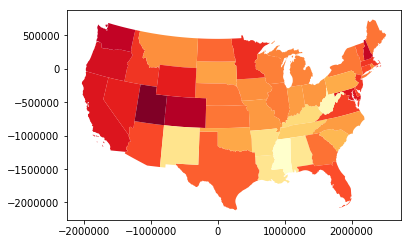
महाद्वीपीय संयुक्त राज्य अमेरिका का मानचित्र, जहाँ राज्यों को कंप्यूटर वाले घरों के अनुपात के अनुसार रंगा गया है.

Python में US Census डेटा का विश्लेषण

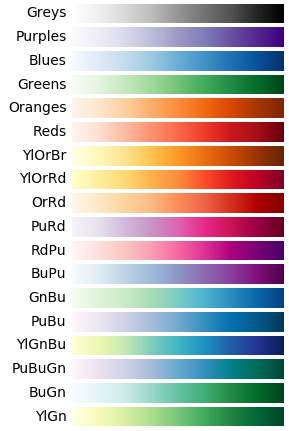
matplotlib में उपलब्ध 18 क्रमिक हल्के-से-गहरे colormaps की रैंप्स.

Matplotlib क्रमिक Colormaps

https://matplotlib.org/users/colormaps.html

Python में US Census डेटा का विश्लेषण

अभ्यास करते हैं!

Python में US Census डेटा का विश्लेषण

Preparing Video For Download...