Mann-Whitney U test

R में A/B Testing

Lauryn Burleigh

Data Scientist

Mann-Whitney U
  • चीज़ बनाम पेपरोनी पिज्जा खाने का समय
  • नॉर्मल वितरण नहीं
  • नॉन-पैरामेट्रिक
    • वितरण का आकार मानकर नहीं चलता
    • Mann-Whitney U test

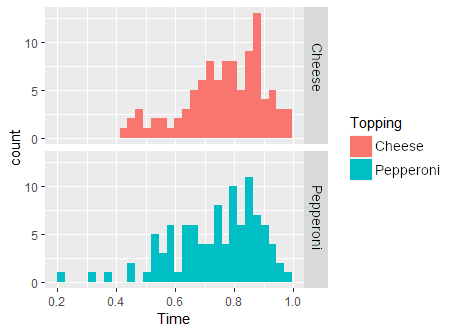
दो बाएँ-झुके हिस्टोग्राम। Pepproni गुलाबी में, औसत 8; Cheese नीले में, औसत 6.2.

R में A/B Testing

मान्यताएँ

  • वितरण के आकार समान
  • मीडियन में अंतर आकलित करता है
  • नॉर्मल वितरण: mean = median
  • नॉन-नॉर्मल: median ज़्यादा उपयुक्त
  • अतिरिक्त मान्यताएँ: अधिक शक्तिशाली टेस्ट
  • शून्य परिकल्पना: चीज़ और पेपरोनी पिज्जा खाने के मीडियन समय में कोई अंतर नहीं
library(ggplot2)
ggplot(pizza, aes(x = Time, 
                  fill = Topping)) +
       geom_histogram() + 
       facet_grid(Topping~.)

दो बाएँ-झुके हिस्टोग्राम। Pepproni गुलाबी में, औसत 8; Cheese नीले में, औसत 6.2.

R में A/B Testing

सैंपल आकार

library(pwr)
pwr.2p2n.test(h = 0.40, 
              sig.level = 0.05, 
              power = 0.8, n1 = 100)
    difference of proportion power 
 calculation for binomial distribution
              h = 0.4
             n1 = 100
             n2 = 96.29156
      sig.level = 0.05
          power = 0.8
    alternative = two.sided
NOTE: different sample sizes
pwr.2p2n.test(h = 0.40, 
              sig.level = 0.05, 
              power = 0.8, n1 = 110)
    difference of proportion power 
 calculation for binomial distribution
              h = 0.4
             n1 = 110
             n2 = 88.54092
      sig.level = 0.05
          power = 0.8
    alternative = two.sided
NOTE: different sample sizes
  • अपेक्षित effect size h: rank-biserial correlation r
    • देखें, समूहों के विषय कैसे रैंक होते हैं
R में A/B Testing

टेस्ट

wilcox.test(Time ~ Topping, 
            data = Pizza)
  • y ~ x
    • y: डेटा
    • x: समूह
    Wilcoxon rank sum test with 
    continuity correction
data:  Enjoyment by Topping
W = 6051, p-value = 0.01026
alternative hypothesis: true location 
shift is not equal to 0
R में A/B Testing

Effect size और power

Effect size

library(effectsize)
rank_biserial(Time ~ Topping, 
              data = pizza)
r (rank biserial) |         95% CI
<----------------------------------
0.21              | [0.05, 0.36]
  • छोटा: 0.1
  • मध्यम: 0.3
  • बड़ा: 0.5

1 - 0.14 = 0.86 Type II error की संभावना

Power Analysis

library(pwr)
pwr.2p2n.test(h = 0.21, sig.level = 0.01, 
              n1 = 100, n2 = 100)
     difference of proportion power calculation for binomial distribution 

              h = 0.21
             n1 = 100
             n2 = 100
      sig.level = 0.01
          power = 0.1376818
    alternative = two.sided

NOTE: different sample sizes
R में A/B Testing

अभ्यास करते हैं!

R में A/B Testing

Preparing Video For Download...